about
brewscheme is a Stata utility for the creation of data visualizations. The package includes tools for conversions between colorspaces, color interpolation, setting global graph aesthetics, setting plot type aesthetics and previewing color palette combinations. Most importantly for Stata users, this program saves you time. Rather than constantly needing to pass arguments to aesthetic parameters, you can create a theme and/or scheme file to store these settings. Then, you only need to pass an argument like scheme(myschemeFileName) to the command to the graph command to use all of your aesthetic settings without having to manually enter them.
Installation
*If you are using a Non-nix based OS you must make sure that the personal directory on your adopath is readable (by default this is usually C:\ado\personal)*. On most systems the personal directory should be writable by the user, but some individuals have had difficulties using brewscheme due to file permission errors they believe were caused by updating to a Non-nix based OS. You can check on the location of your personal directory using sysdir from within Stata.
Additional information about installation
If you already installed a previous version of brewscheme, there are a few quick/minor things you’ll need to do on your system to enable all the functionality of the programs:
// Next build out the color database (which also creates color blind translations of the Stata named color styles)
brewcolordb, replace

// If you also wanted to install all of the named colors available from the XKCD you can skip the step above and use:
brewcolors xkcd, make install replace

// If you've previously installed brewscheme, you'll also need to rebuild the look up data set used by brewscheme
// to build the scheme files (the difference is that this file will now also include the color sight impairment simulation values)
// You can also accomplish the step above this by passing the refresh option to brewscheme
brewdb, replace
If you used the second option above brewcolors xkcd, make install replace, you should see something like:
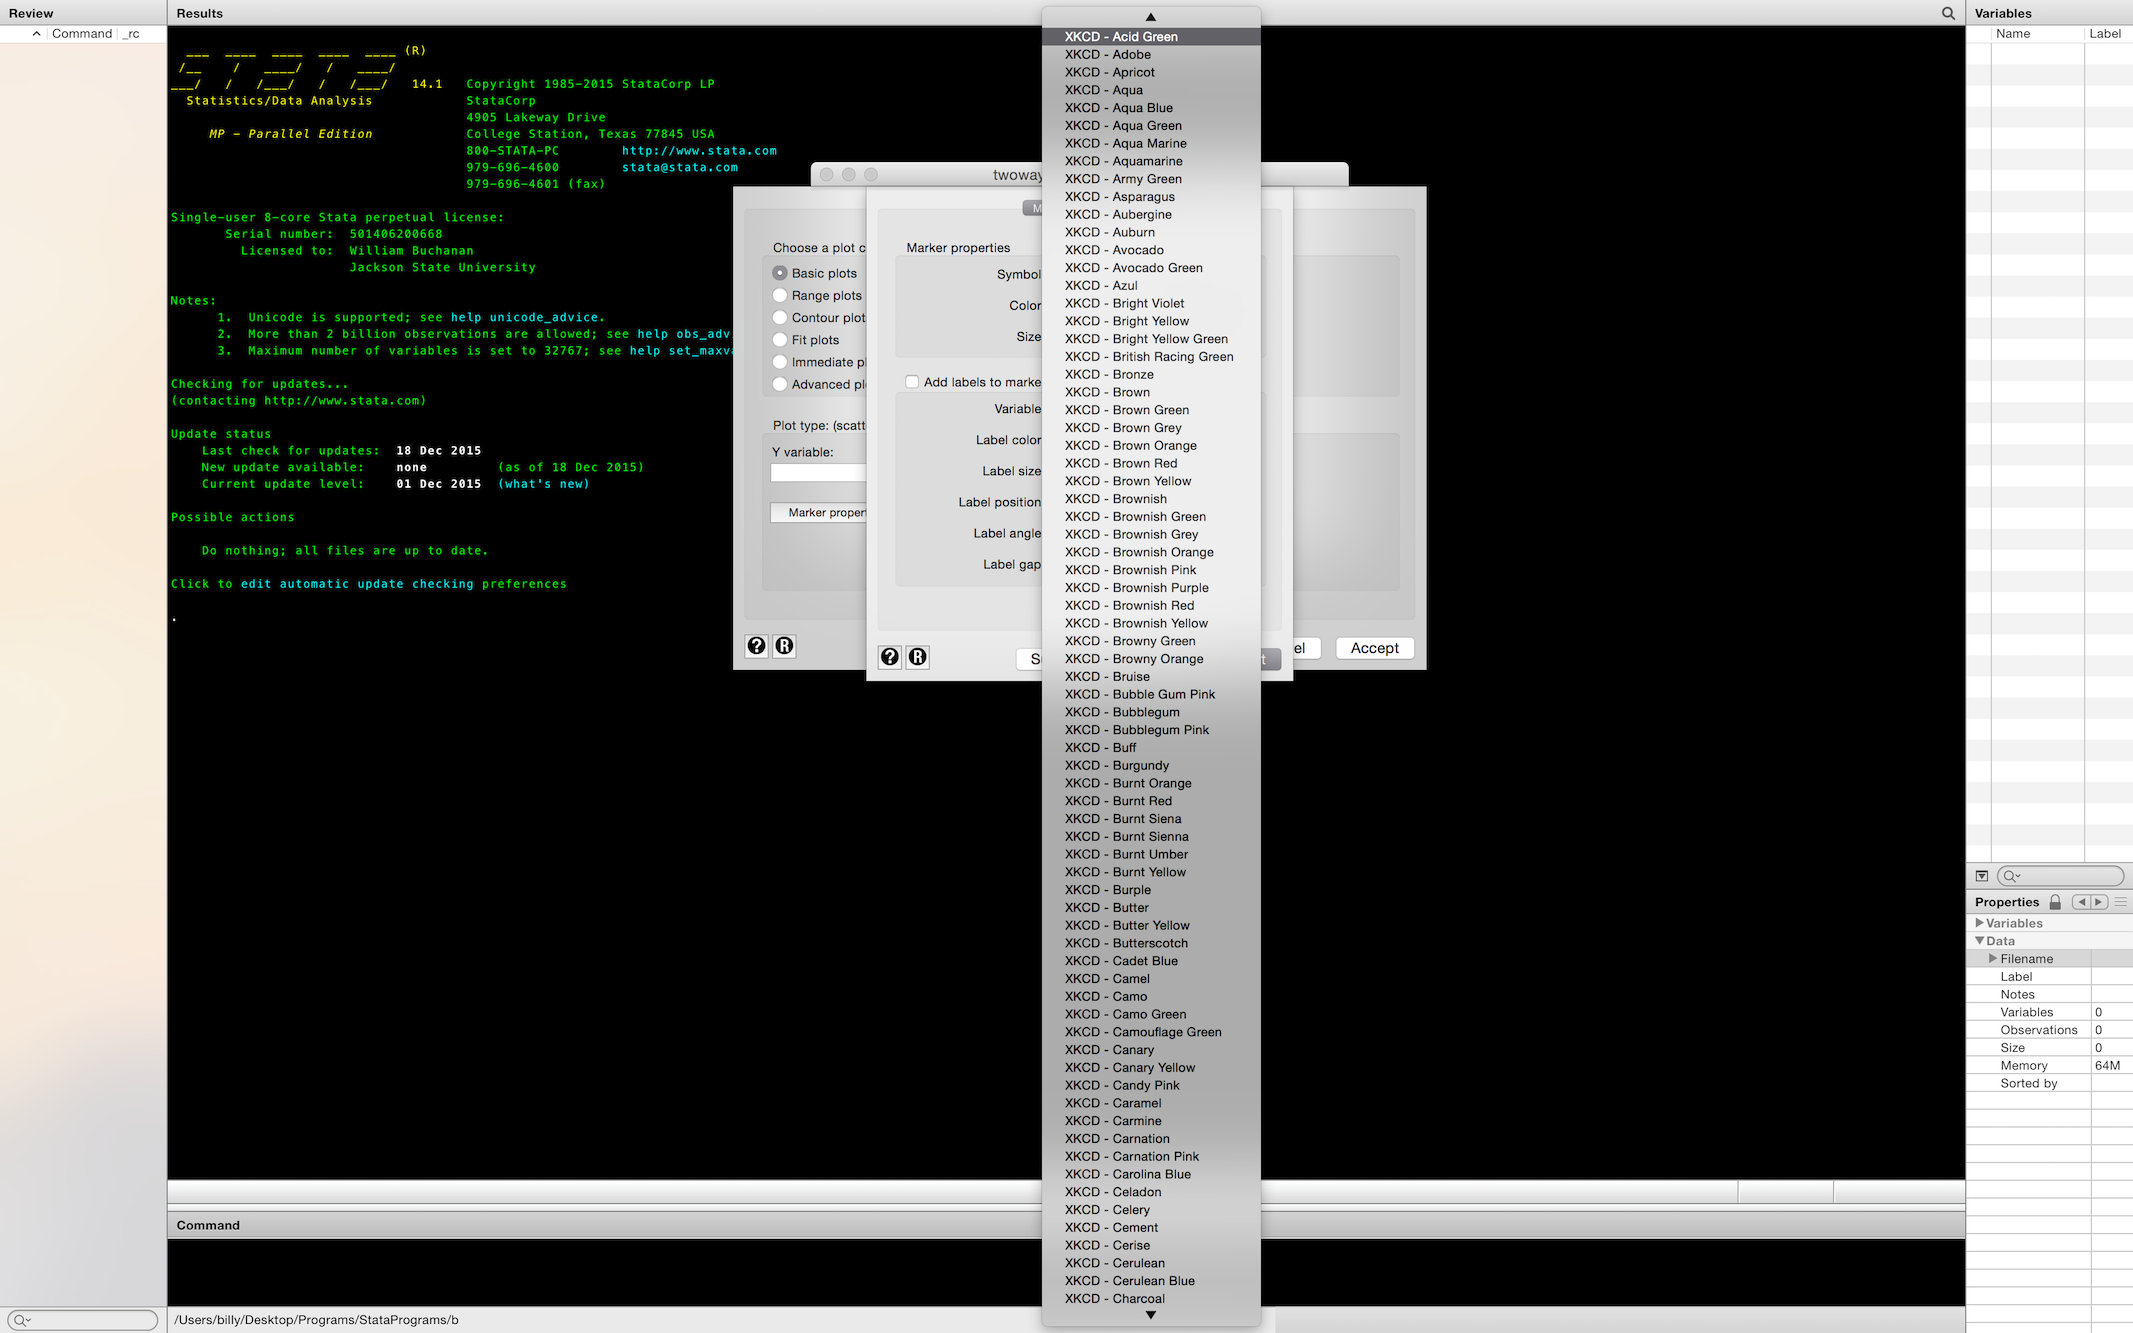
when you look for named color styles in Stata. Additionally, you should also have translated version of the Stata named color styles available as well:
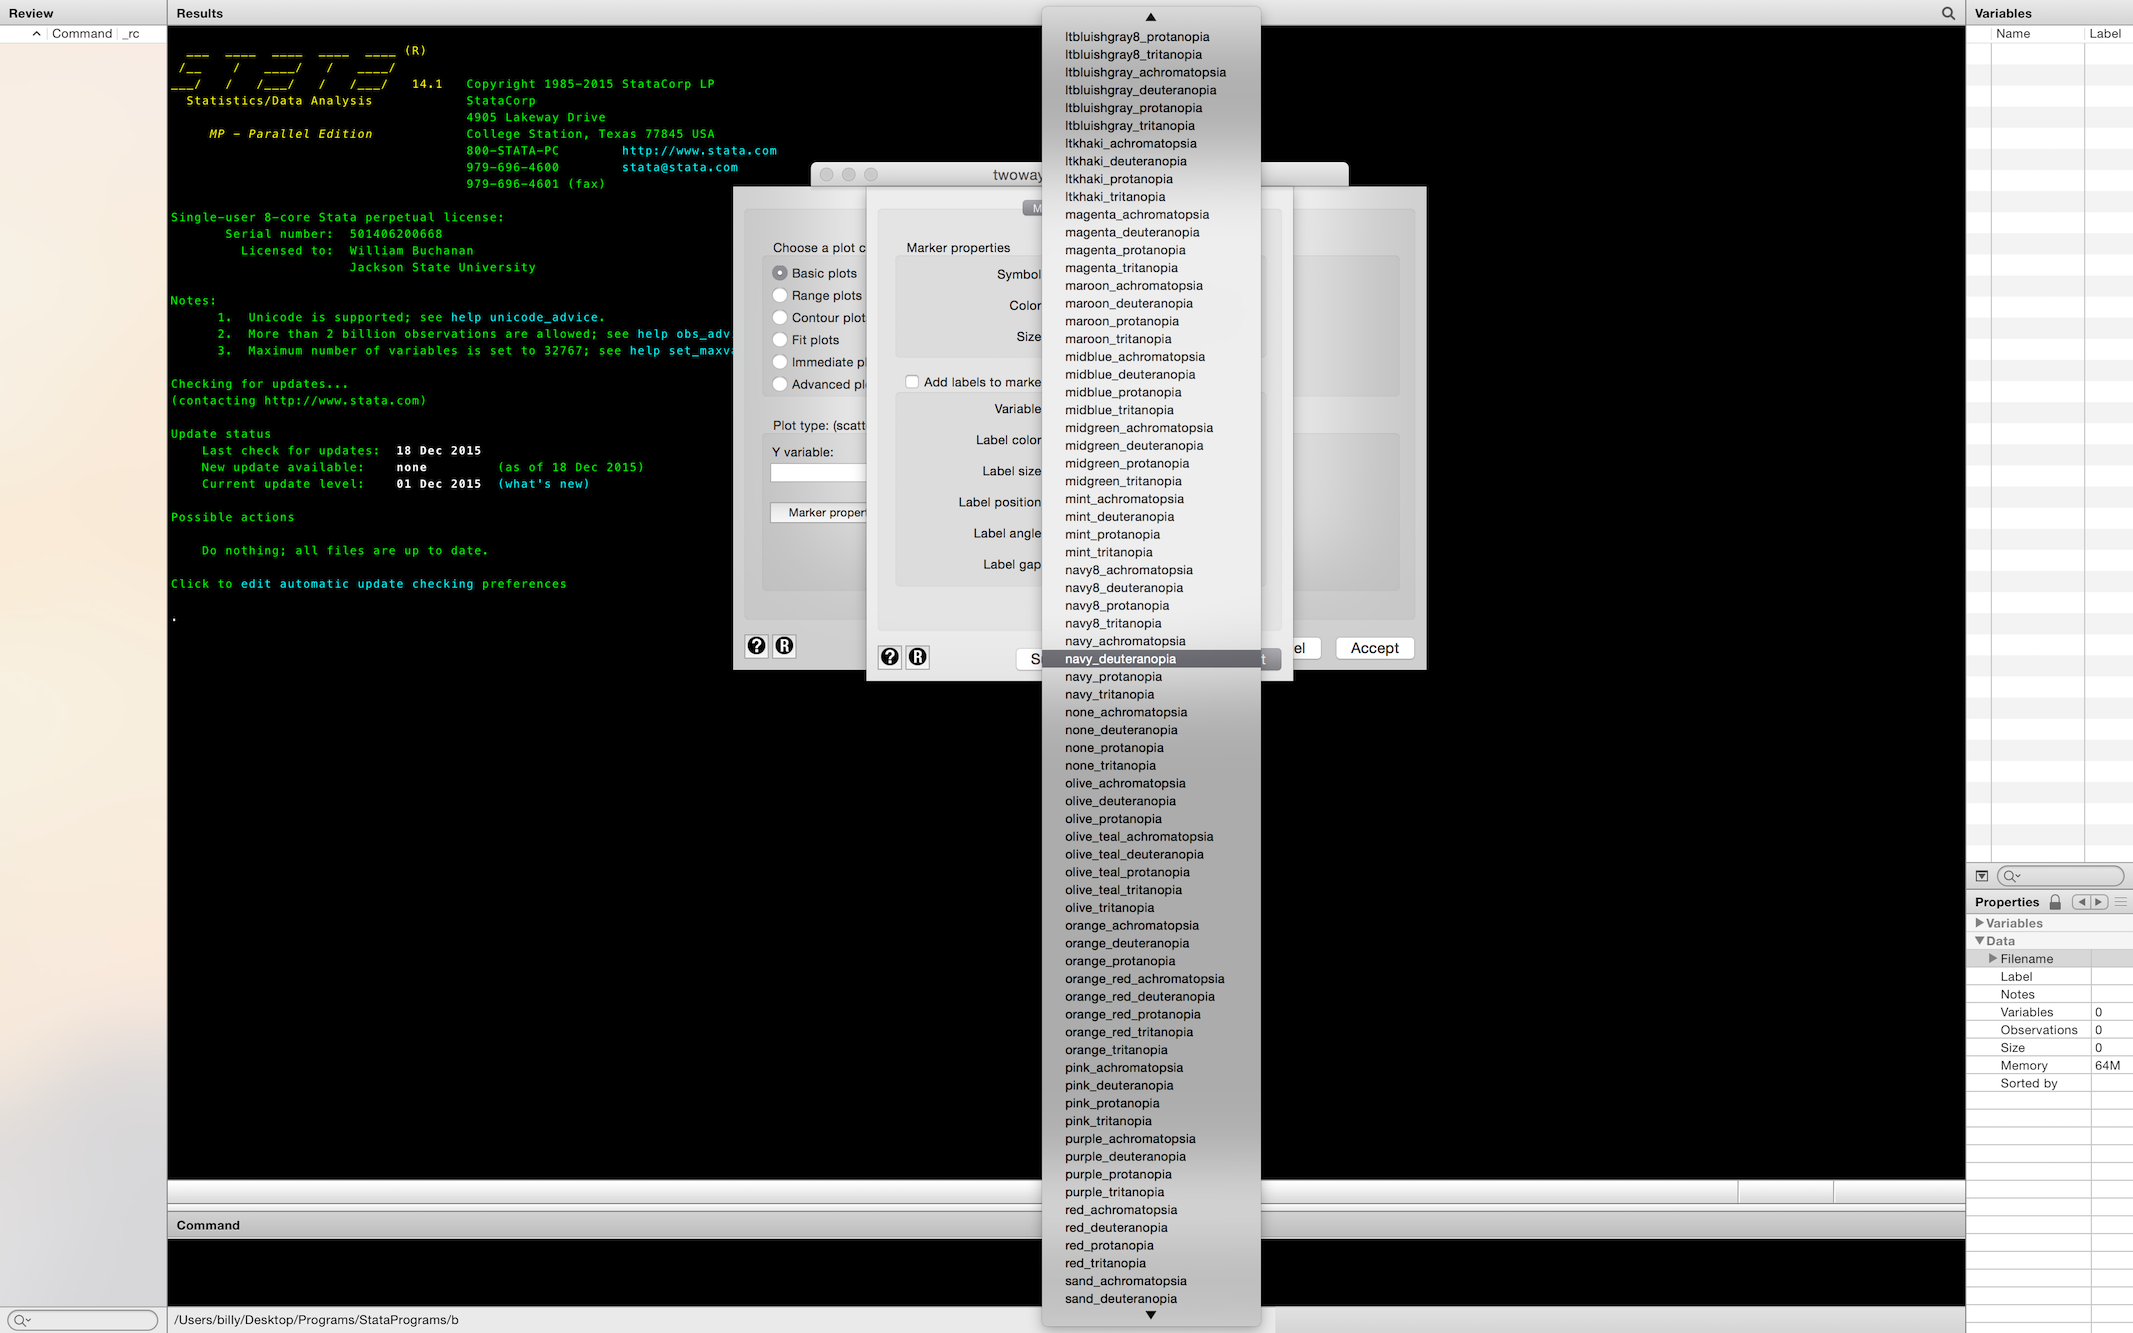
Once you’ve done this you should be all set. If the look up database is not present when brewscheme is called it will build the file automatically for you, but before you can create a scheme/theme file you’ll need to have the data set and modified named color styles created by brewcolordb.
Things to check when uninstalling/reinstalling brewscheme
There are a few files that may not be uninstalled if you use the ado uninstall [#] command to uninstall brewscheme. The following snippet should help to make sure that these files get removed for you:
loc files libbrewscheme.mlib brewterpolate.jar filesys.jar
foreach v of loc files {
	cap findfile `v'
	if !mi(`"`r(fn)'"') qui: erase "`r(fn)'"
}