brewviewer
A command to preview one or more brewscheme color palettes
brewviewer – A utility for brewscheme to preview color palettes available.
Syntax
brewviewer palette names [, colors(numlist) combine seq impaired ]
Description
brewviewer is a utility for the brewscheme program that provides you with a way to preview different combinations of palettes and numbers of colors. You can view examples of each of the palettes distributed with brewscheme in the Gallery below. The table below is provided for more immediate access to a specific color palette preview:
For additional information about the palettes and/or transformations, see the references listed below.
Options
colors is a required argument and is used to specify the number of colors to preview. If a single argument is passed it is used for all palettes. If the number of color values passed is the same as the number of palettes the program will treat the values as being specific to the corresponding palette specified. If there are fewer colors than palettes, the maximum value of the colors parameter will be used for the graphs if the seq option is passed, else the same colors are recycled for each of the graphs. Lastly, if the number of colors passed is greater than the number of palettes, it will override the seq option and treat each of the numbers as discrete for all palettes.
combine is an optional argument used to generate a single combined graph with each of the graphs combined in a single image.
seq is an optional argument used to tell the program that you want to treat the number of colors as the maximum number of sequences to graph. For example, if a value of 5 is passed to colors and seq is selected, the resulting graph will contain columns showing colors 1-3, 1-4, and 1-5. If this option is not selected, it will only show a single column of colors from 1-5.
impaired is an optional argument to display the palette(s) along with color sight impaired transformations of the colors.
Examples
Ex 1.
Show the D3js category10 palette with up to 6 colors with color sight impaired transformed colors
brewviewer category10, im seq c(6)

Ex 2.
Display colors from multiple palettes with varying numbers of colors for each palette.
brewviewer category10 category20 category20b category20c, c(5 8 10 12) comb seq

Ex 3.
Preview sequences for color palettes with 3-5 colors for multiple palettes simultaneously and combine in a single image.
brewviewer dark2 mdebar accent pastel2 set1 tableau, c(5) seq comb

Ex 4.
Similar to example above, but only show instances with the colors 1-5 for each of the color palettes:
brewviewer dark2 mdebar accent pastel2 set1 tableau, c(5) comb

Acknowledgements
This subroutine for brewscheme was inspired and influenced by Mattieu Gomez’s program stata-colorscheme.
Gallery
The full set of palettes (based on the maximum number of colors available in the palette), displayed with the sequential option and impaired options is available below.
accent
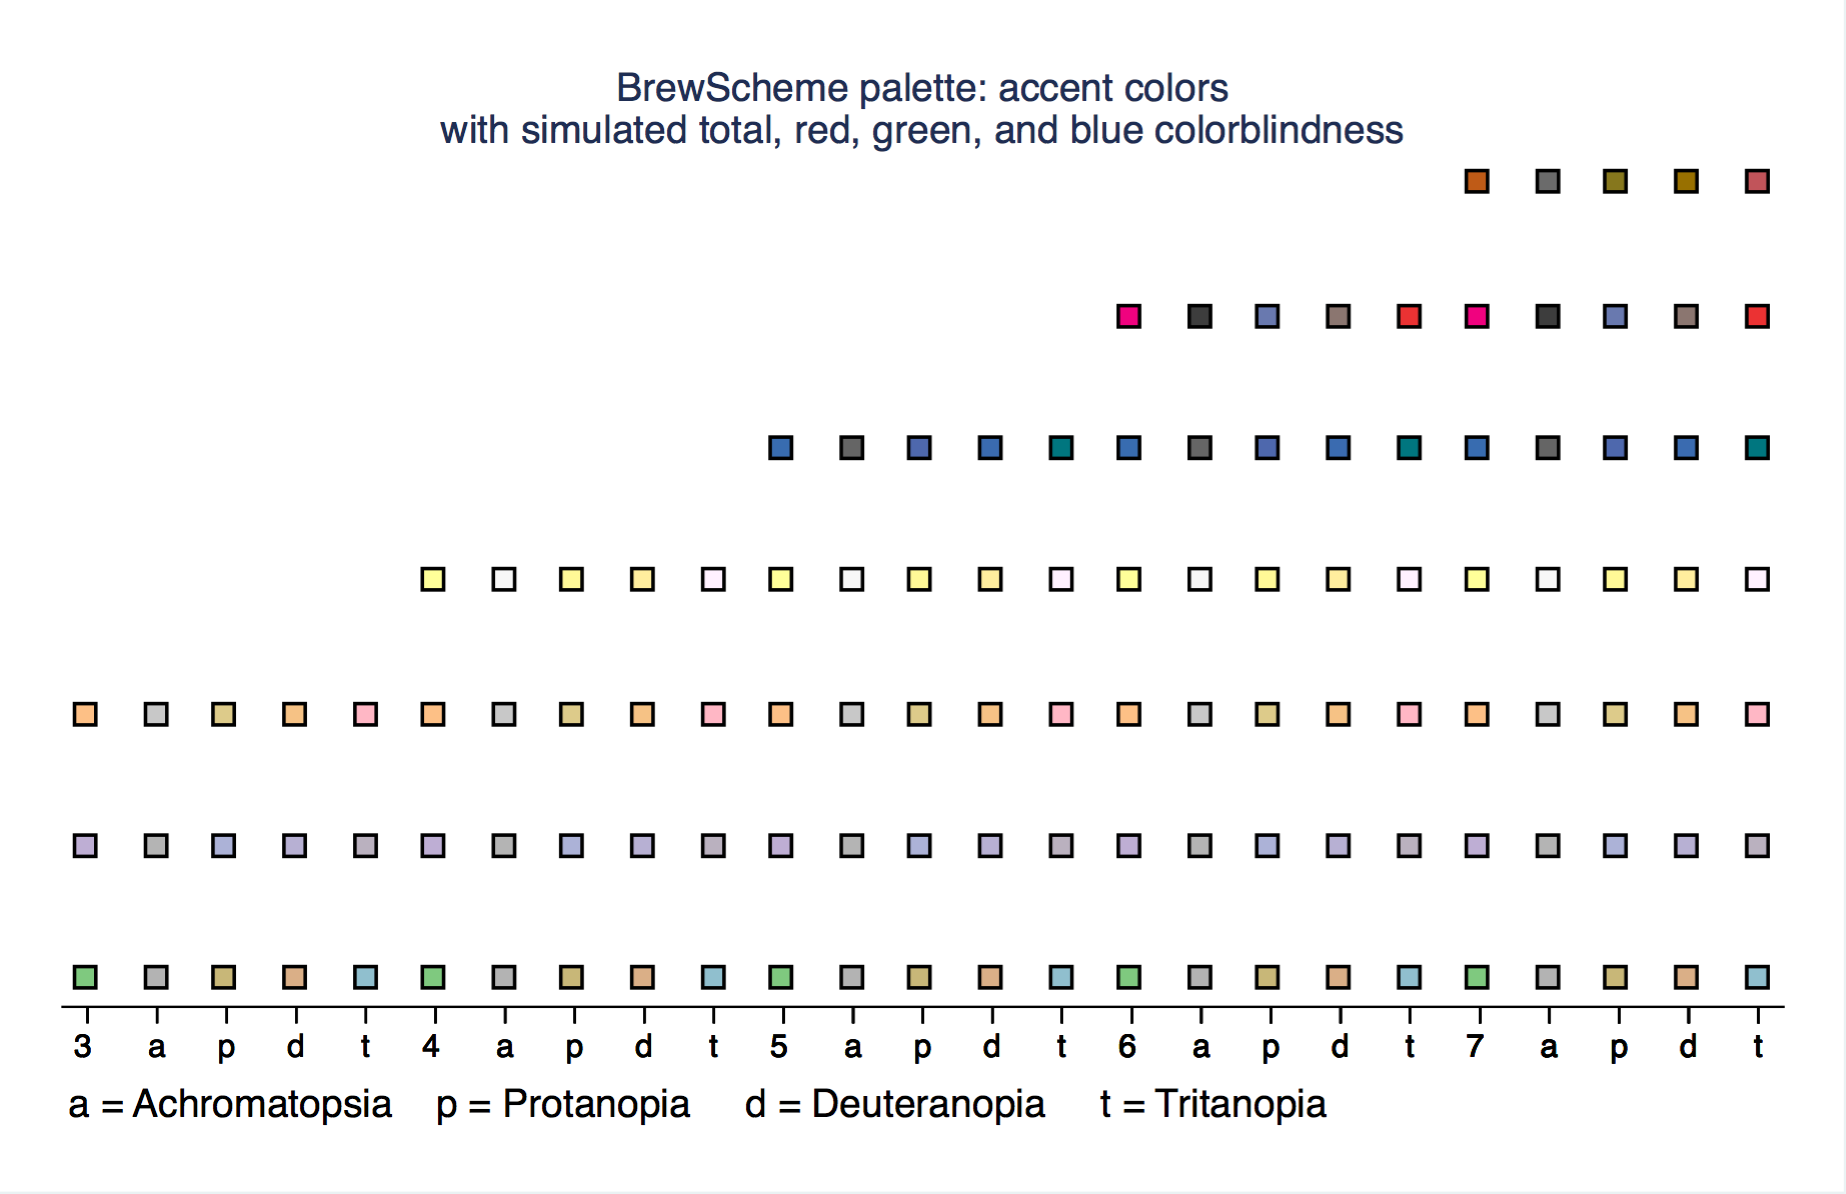 top of the gallery back to the top
activitiesa
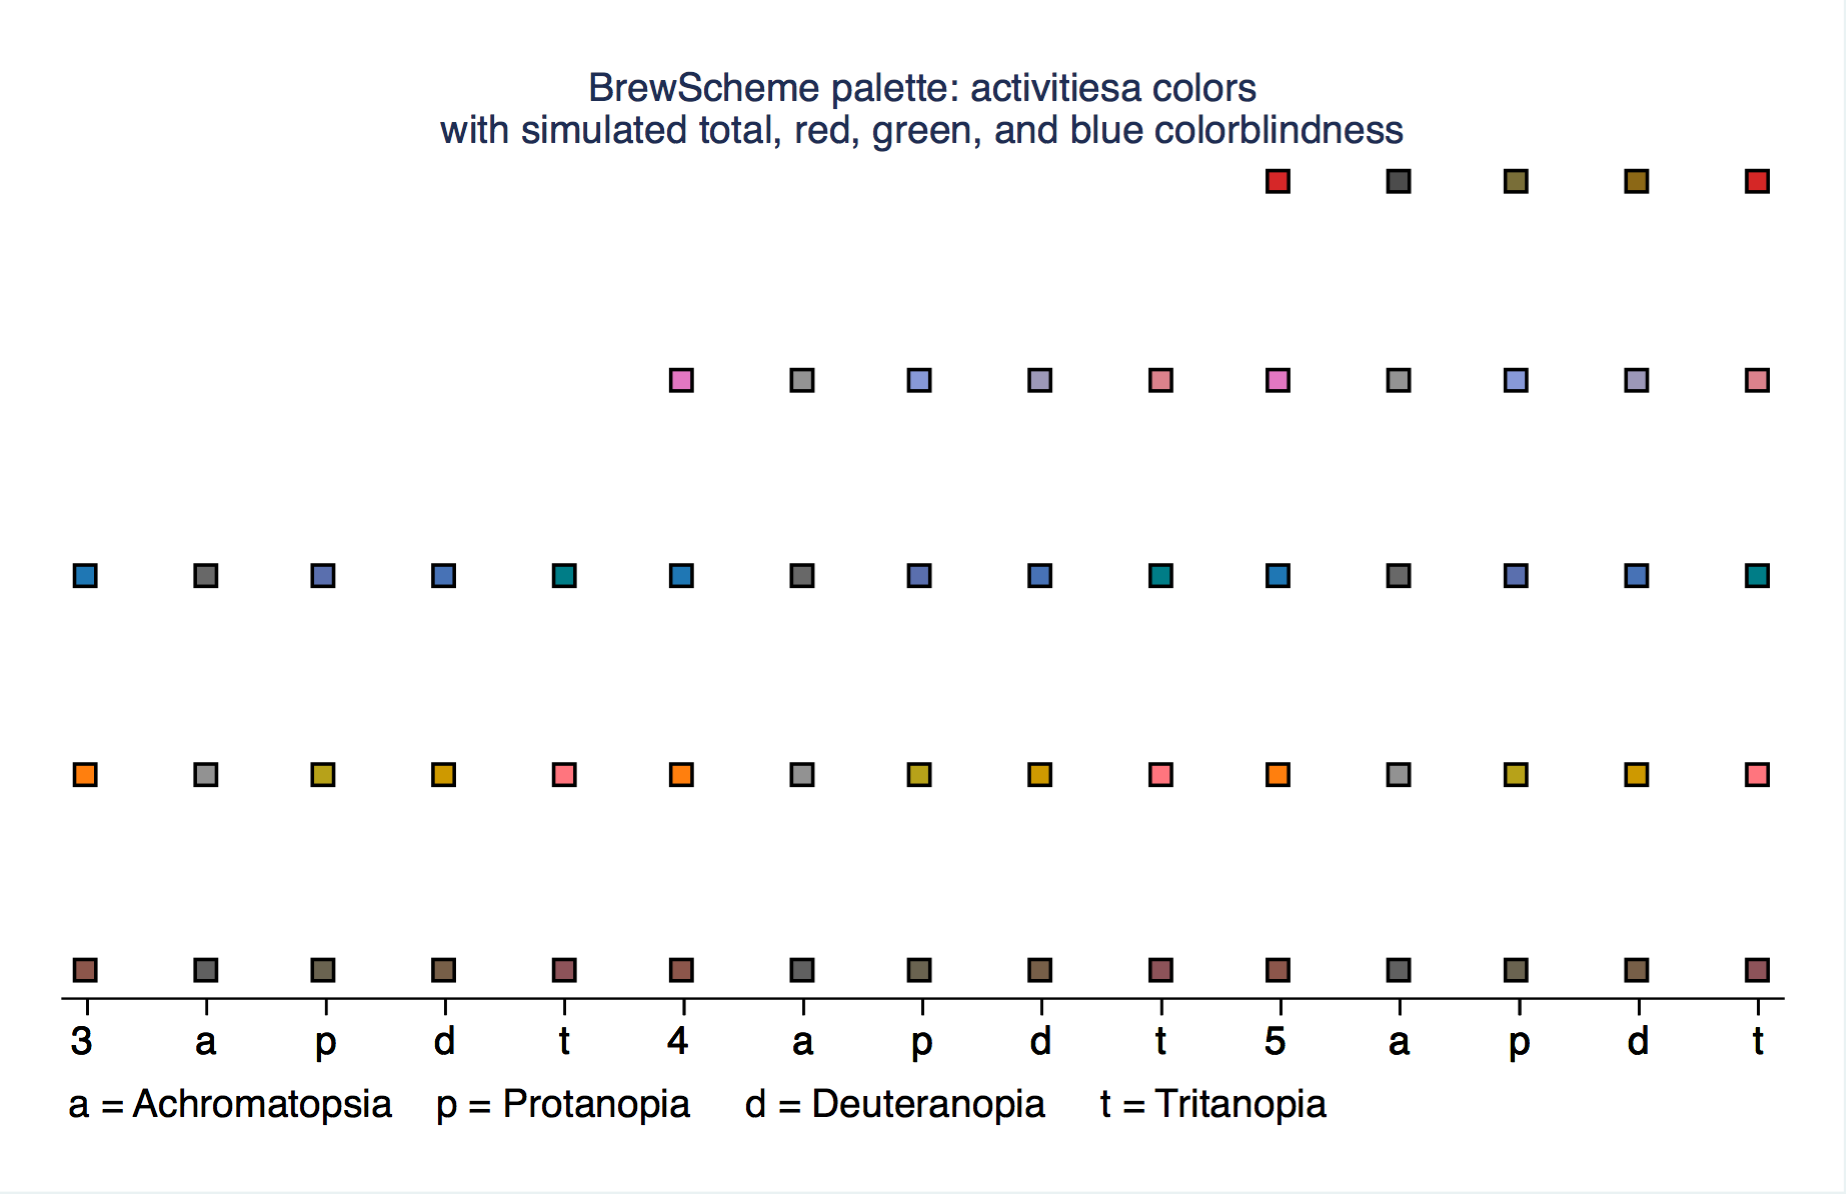 top of the gallery back to the top
activitiest
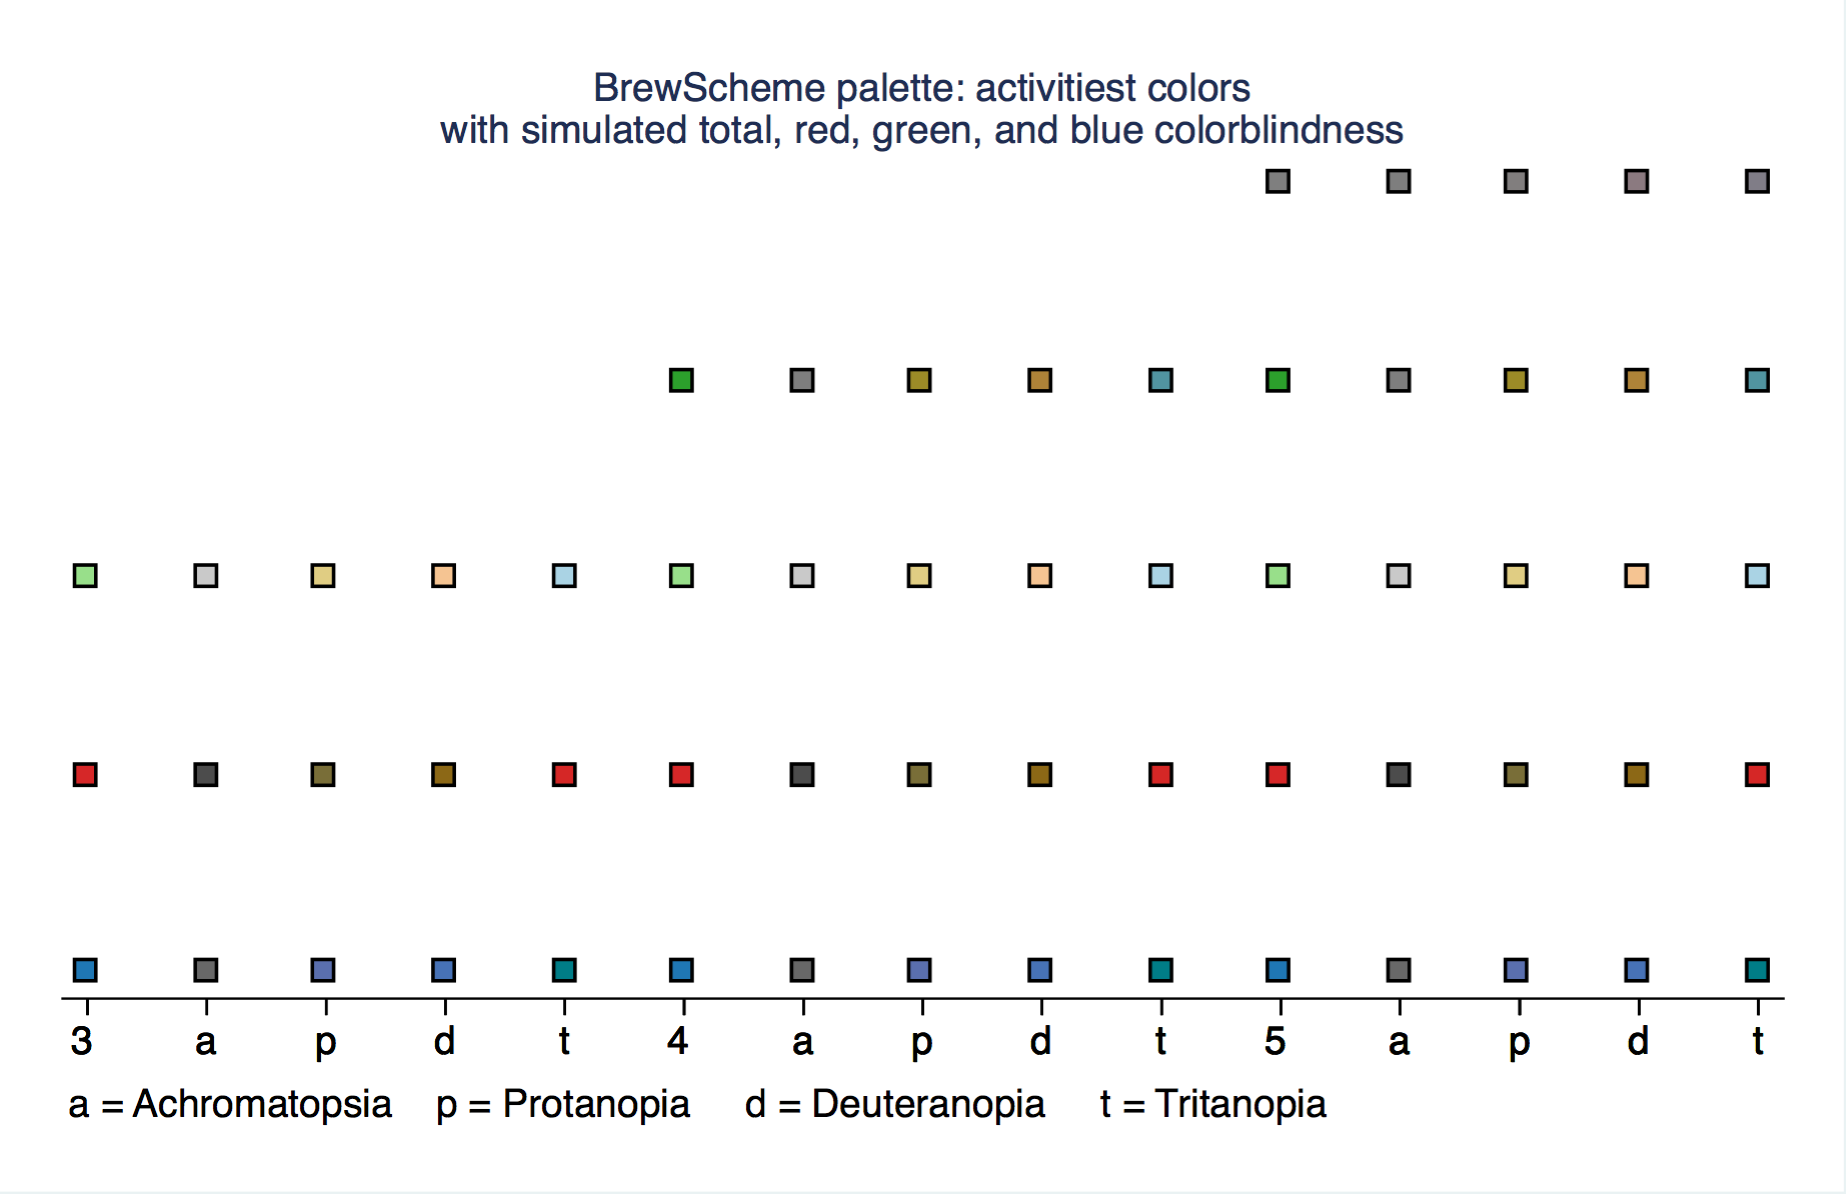 top of the gallery back to the top
blues
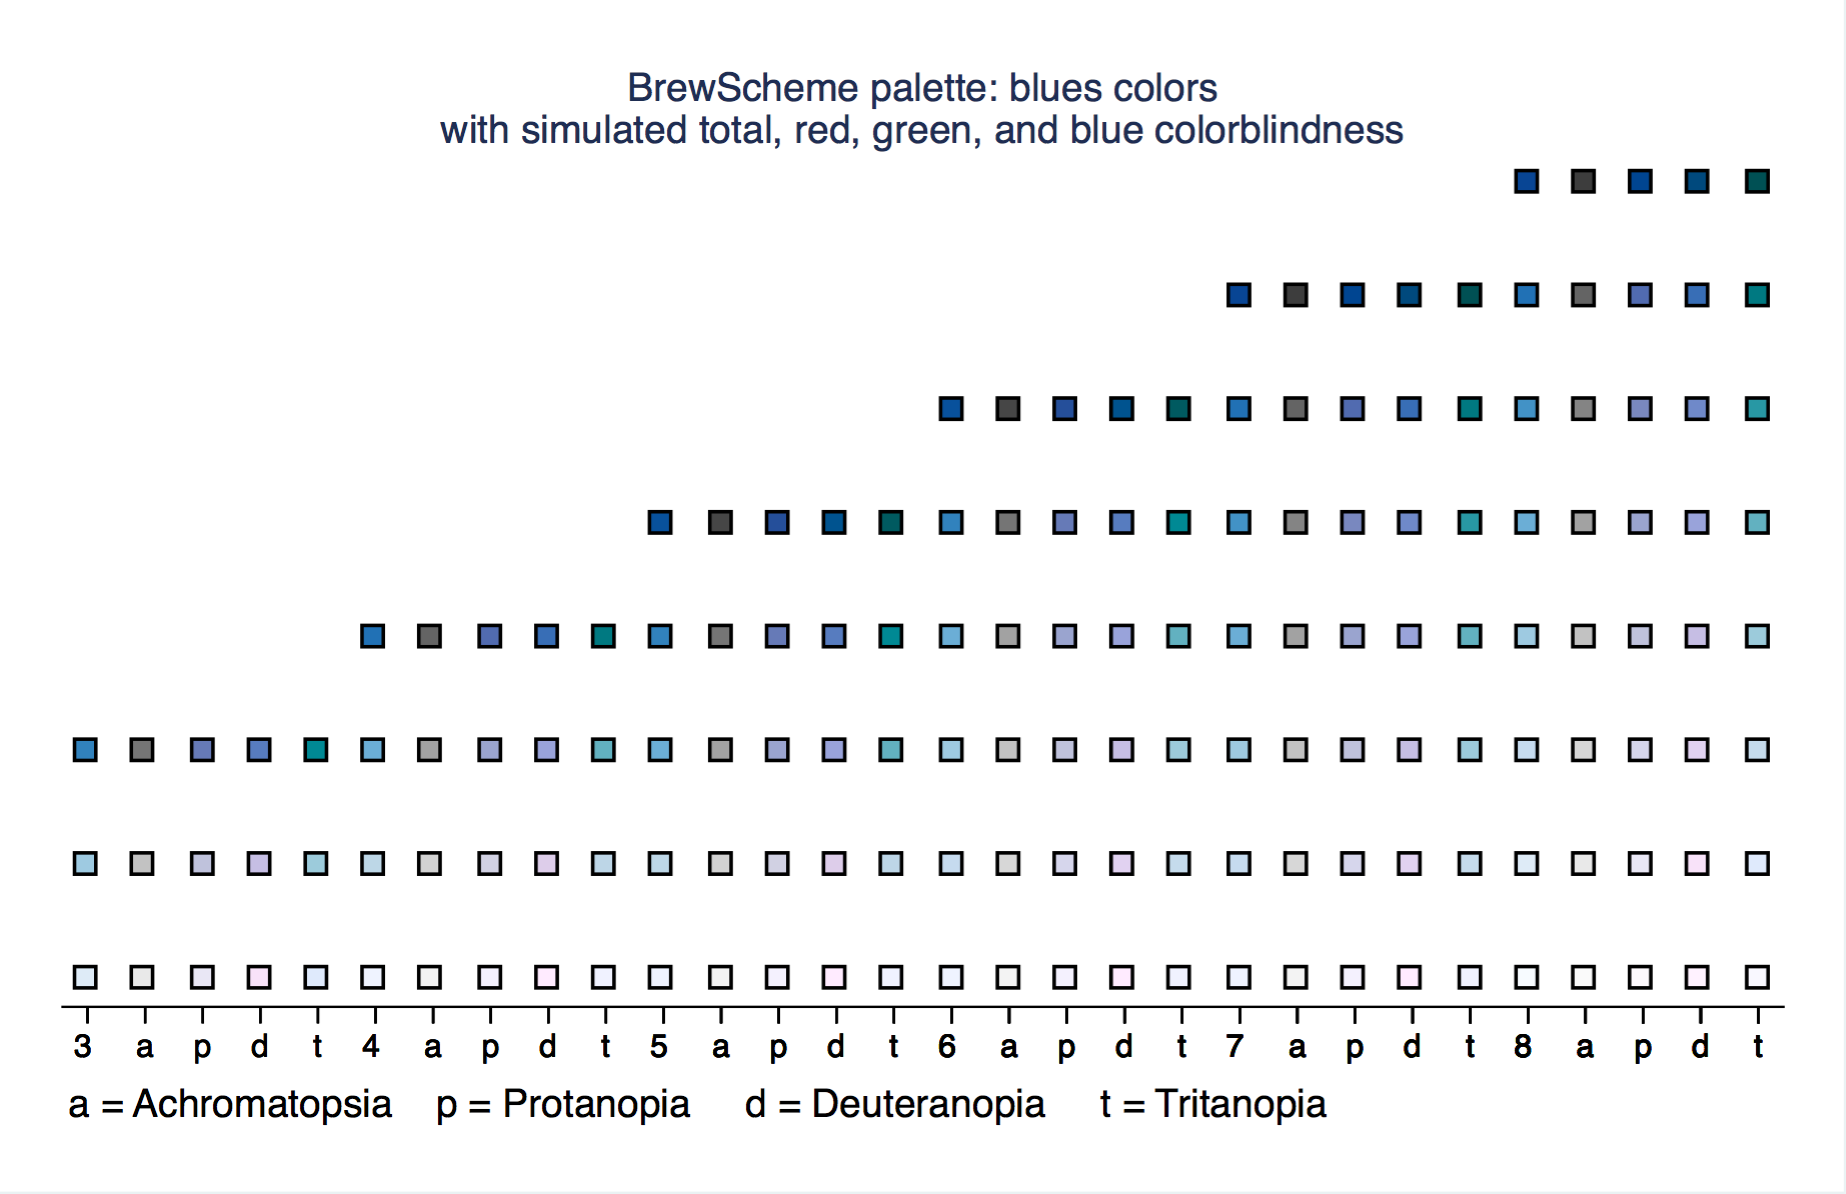 top of the gallery back to the top
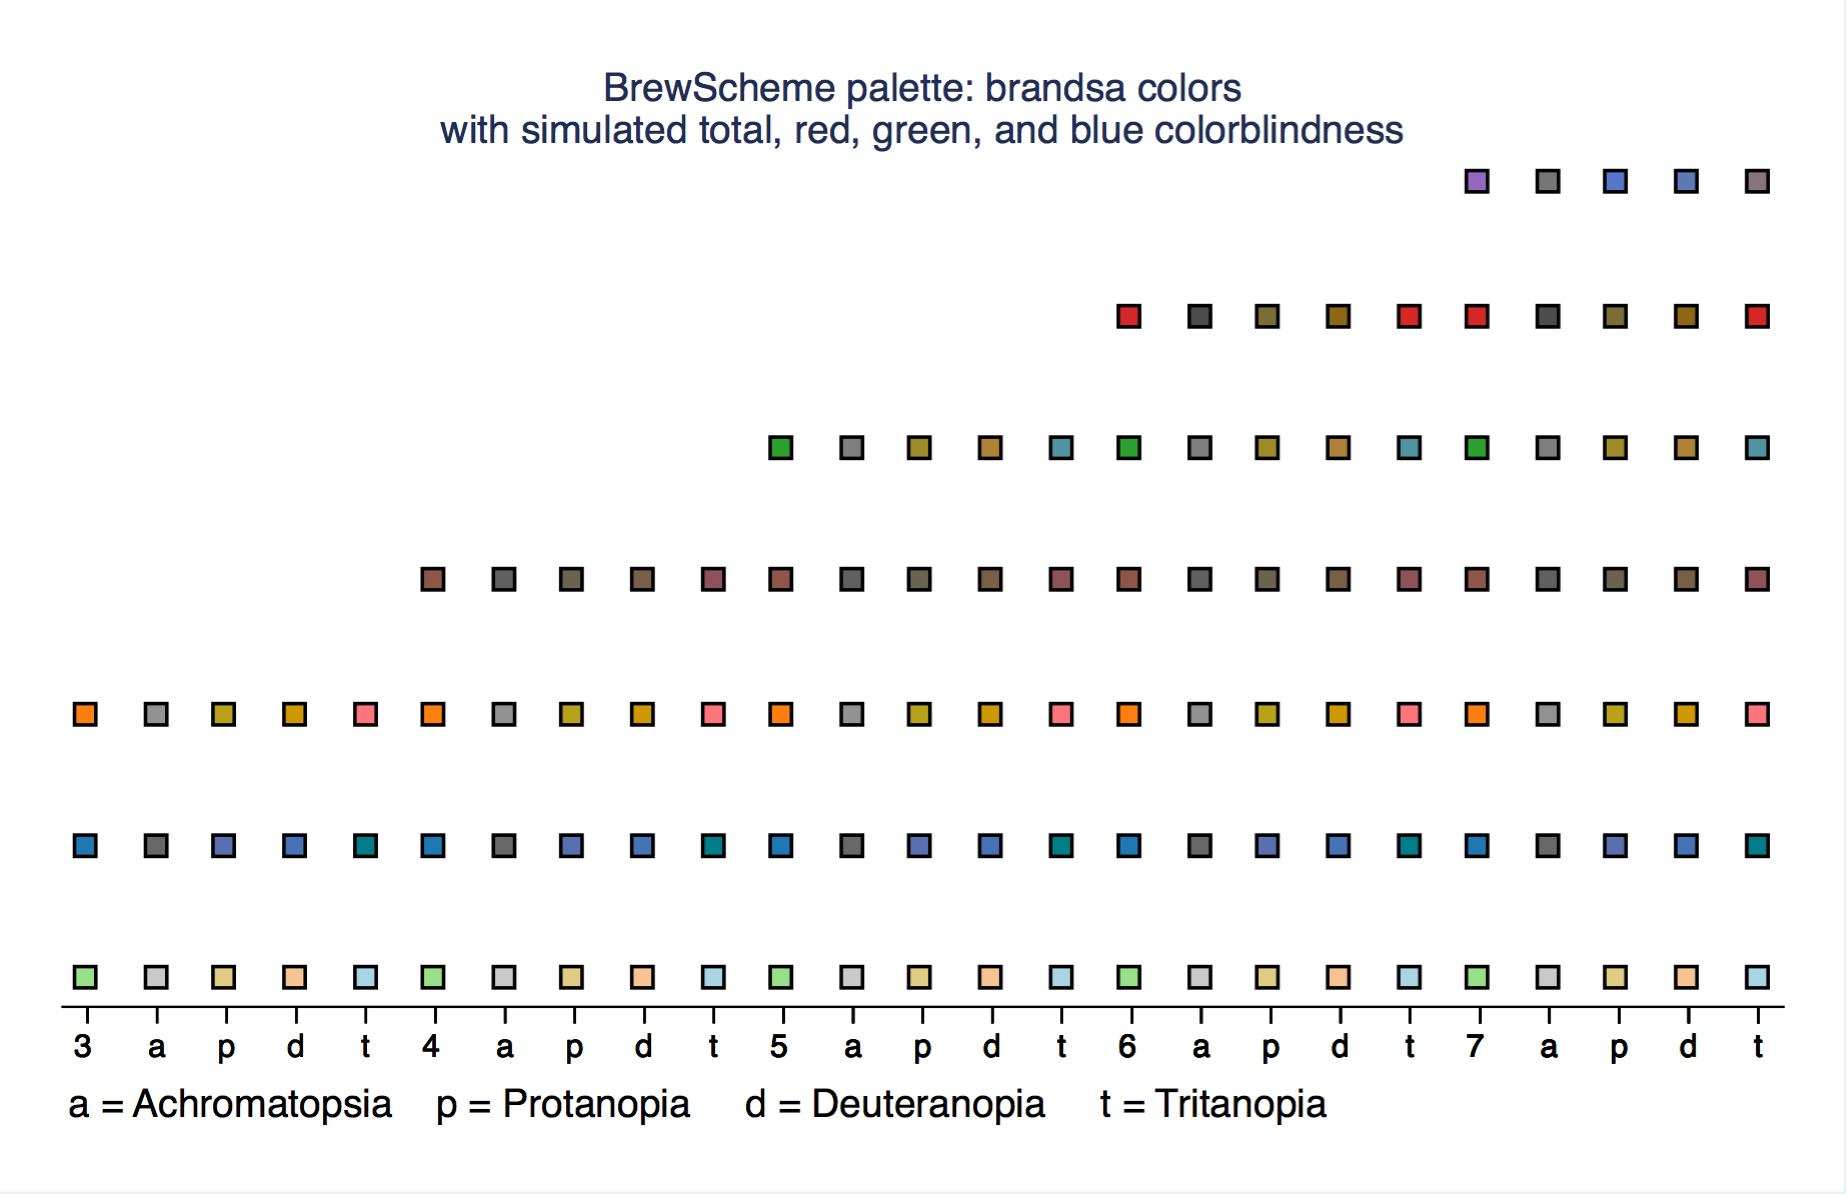
brandsa
 top of the gallery back to the top
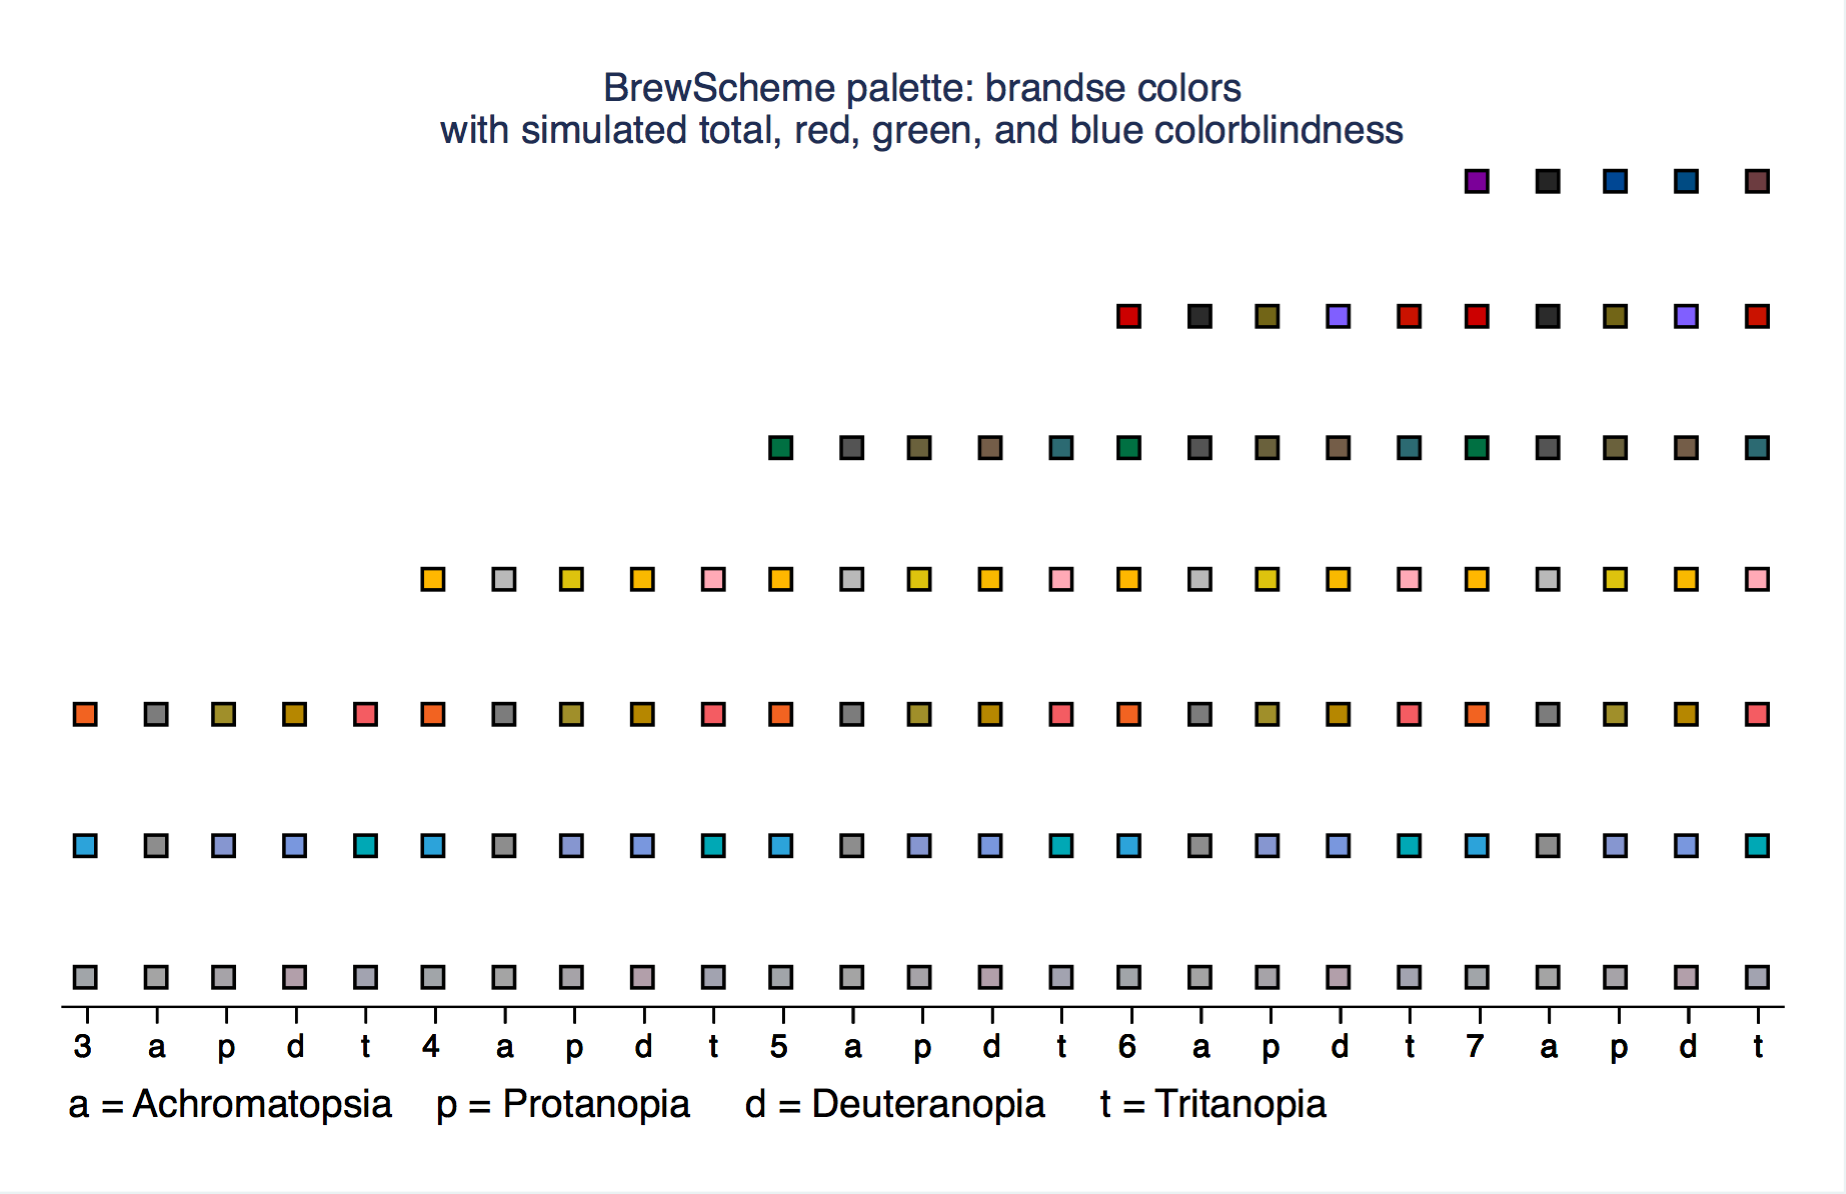
brandse
 top of the gallery back to the top
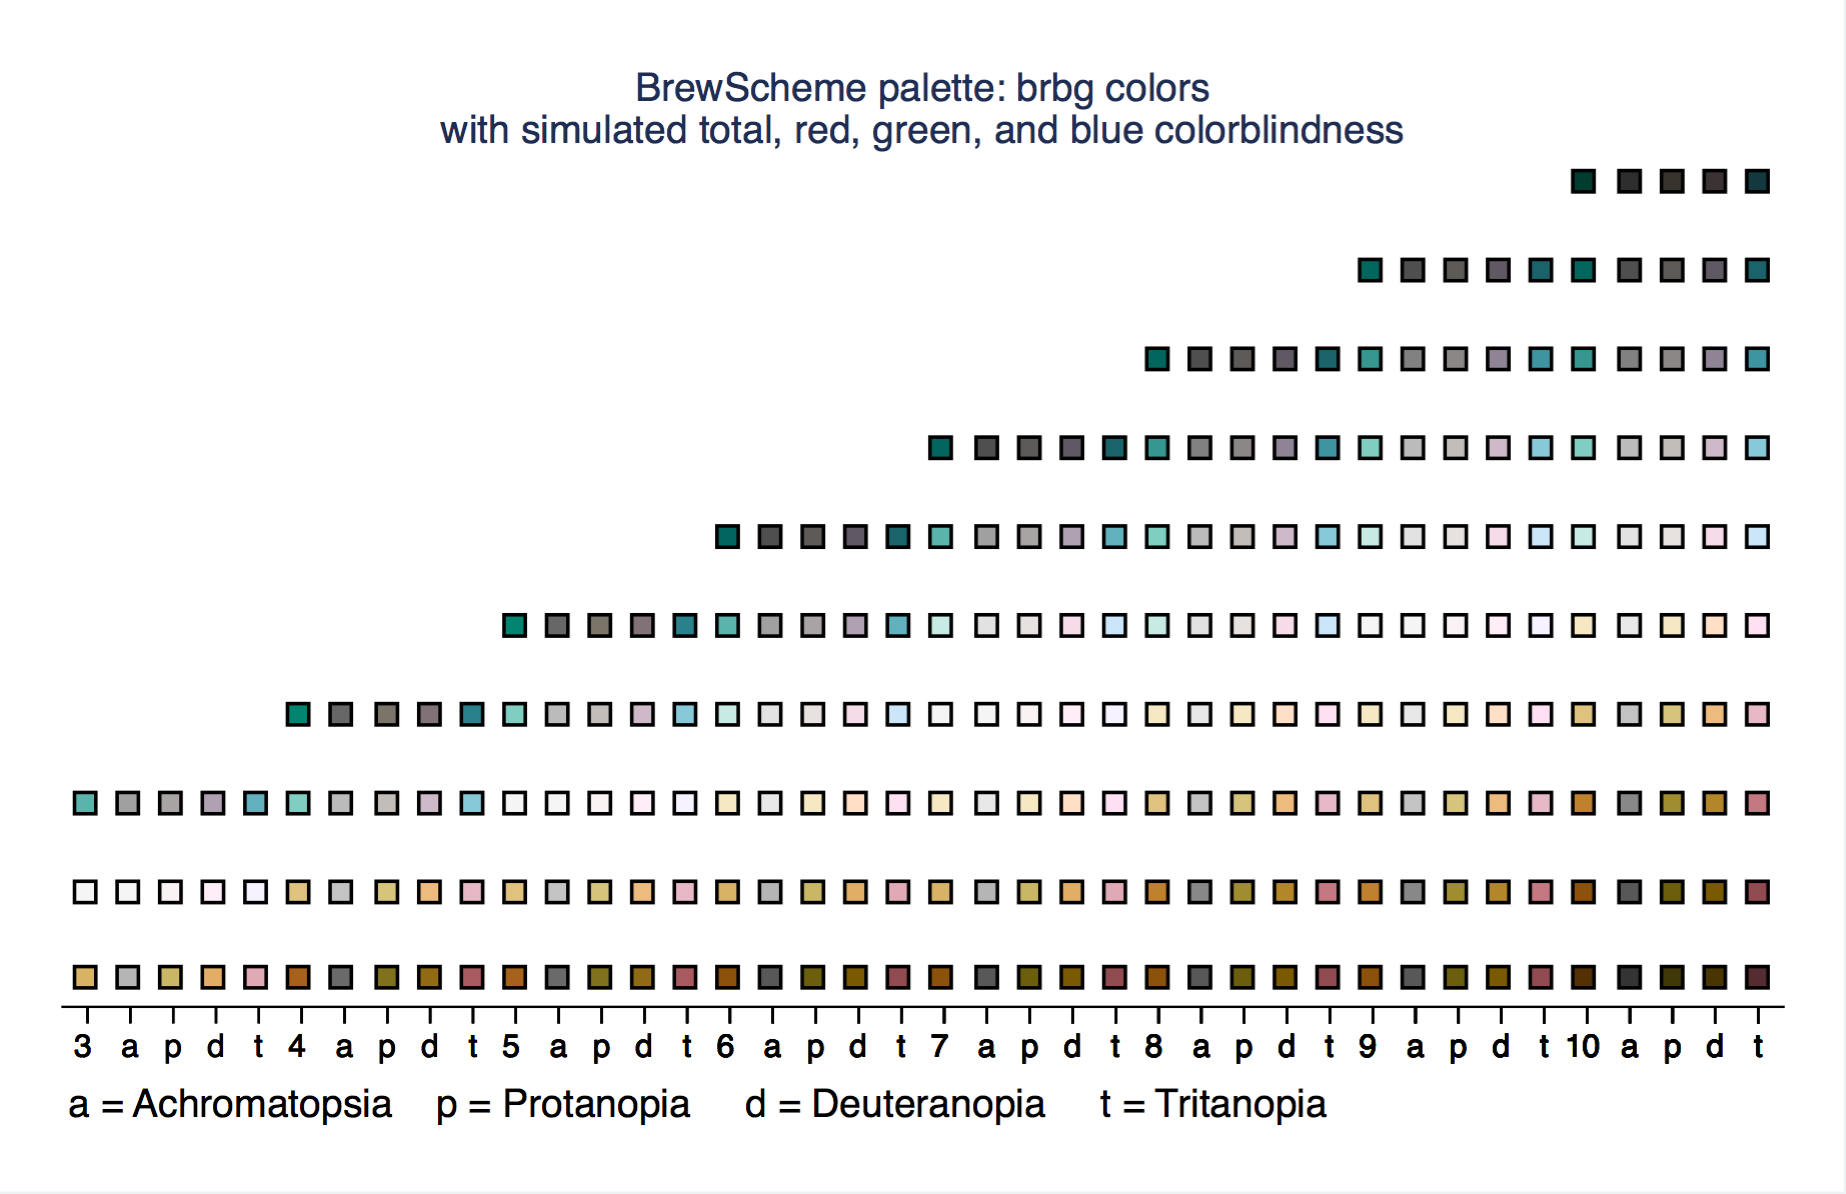
brbg
 top of the gallery back to the top
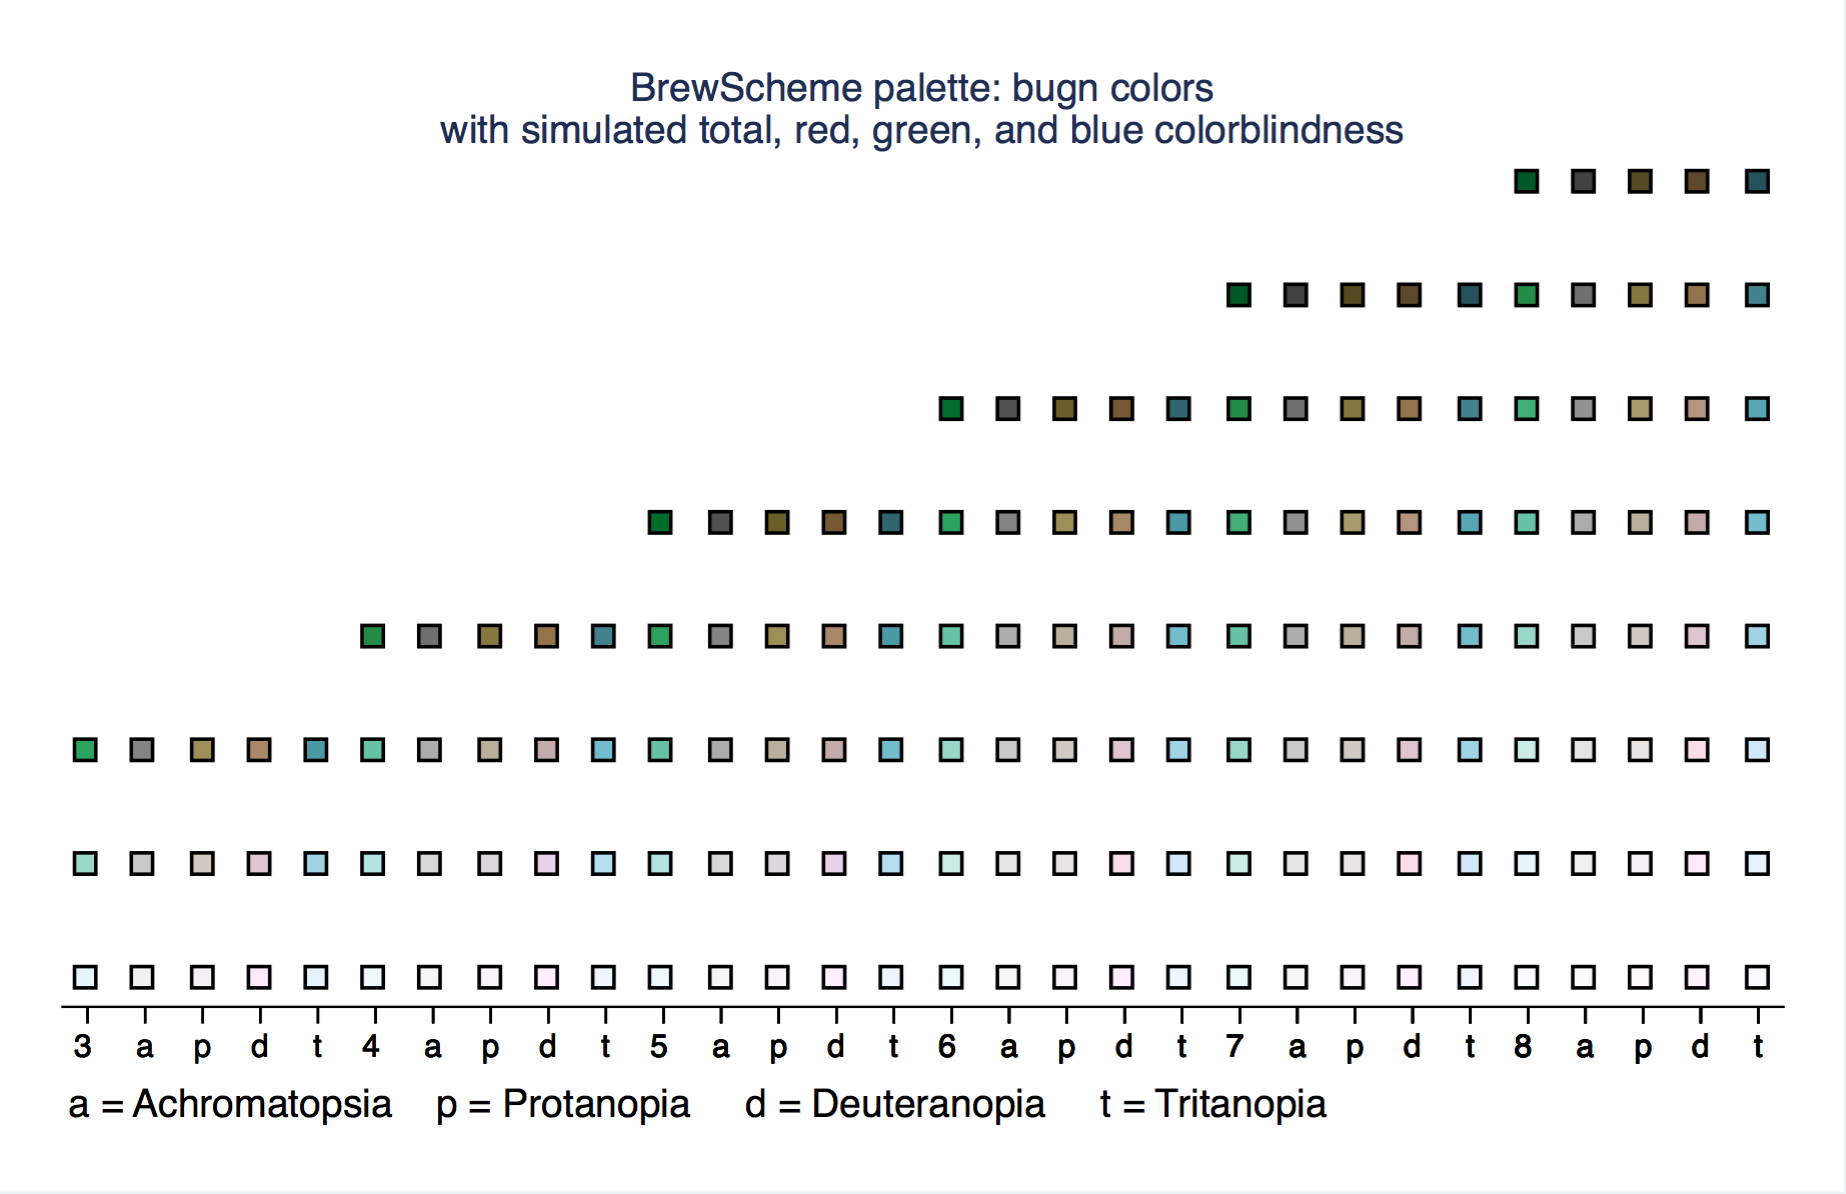
bugn
 top of the gallery back to the top
bupu
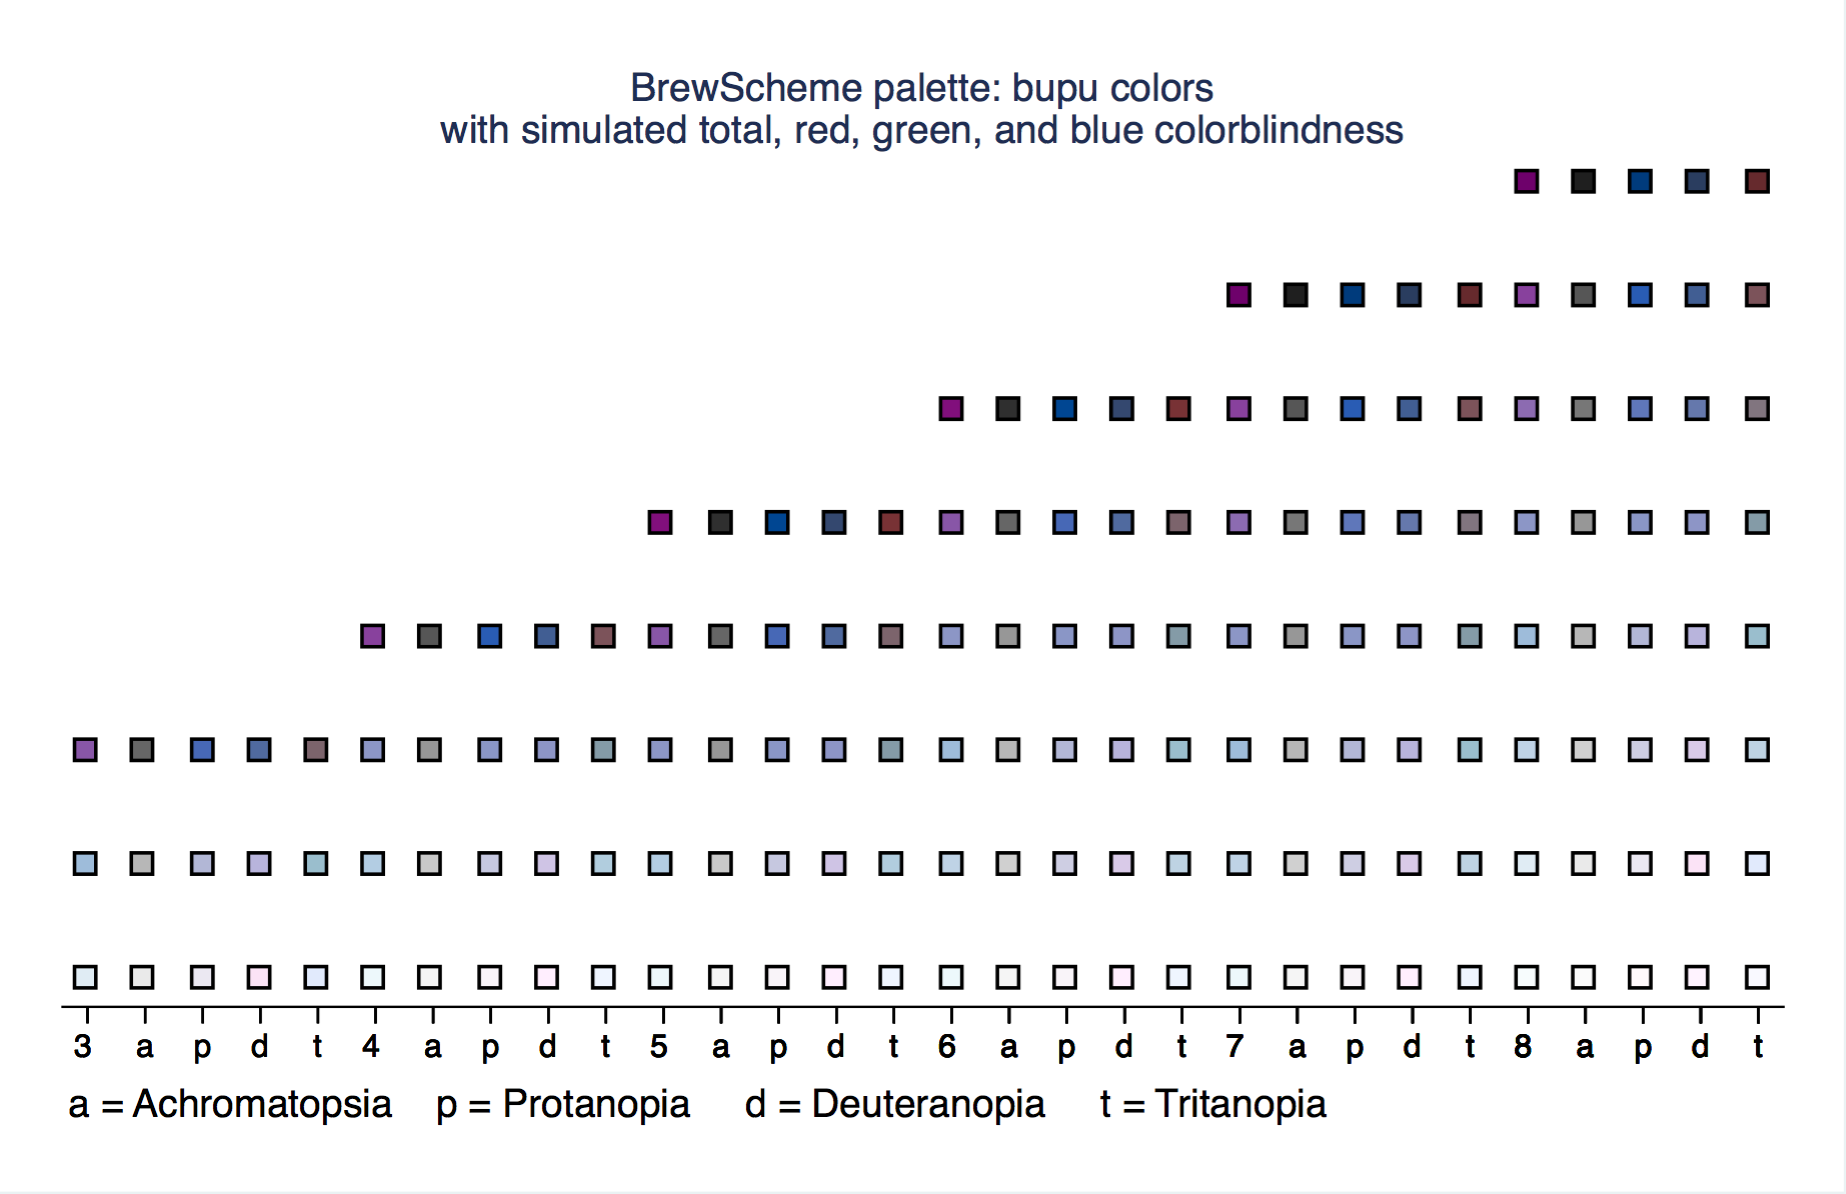 top of the gallery back to the top
carsa
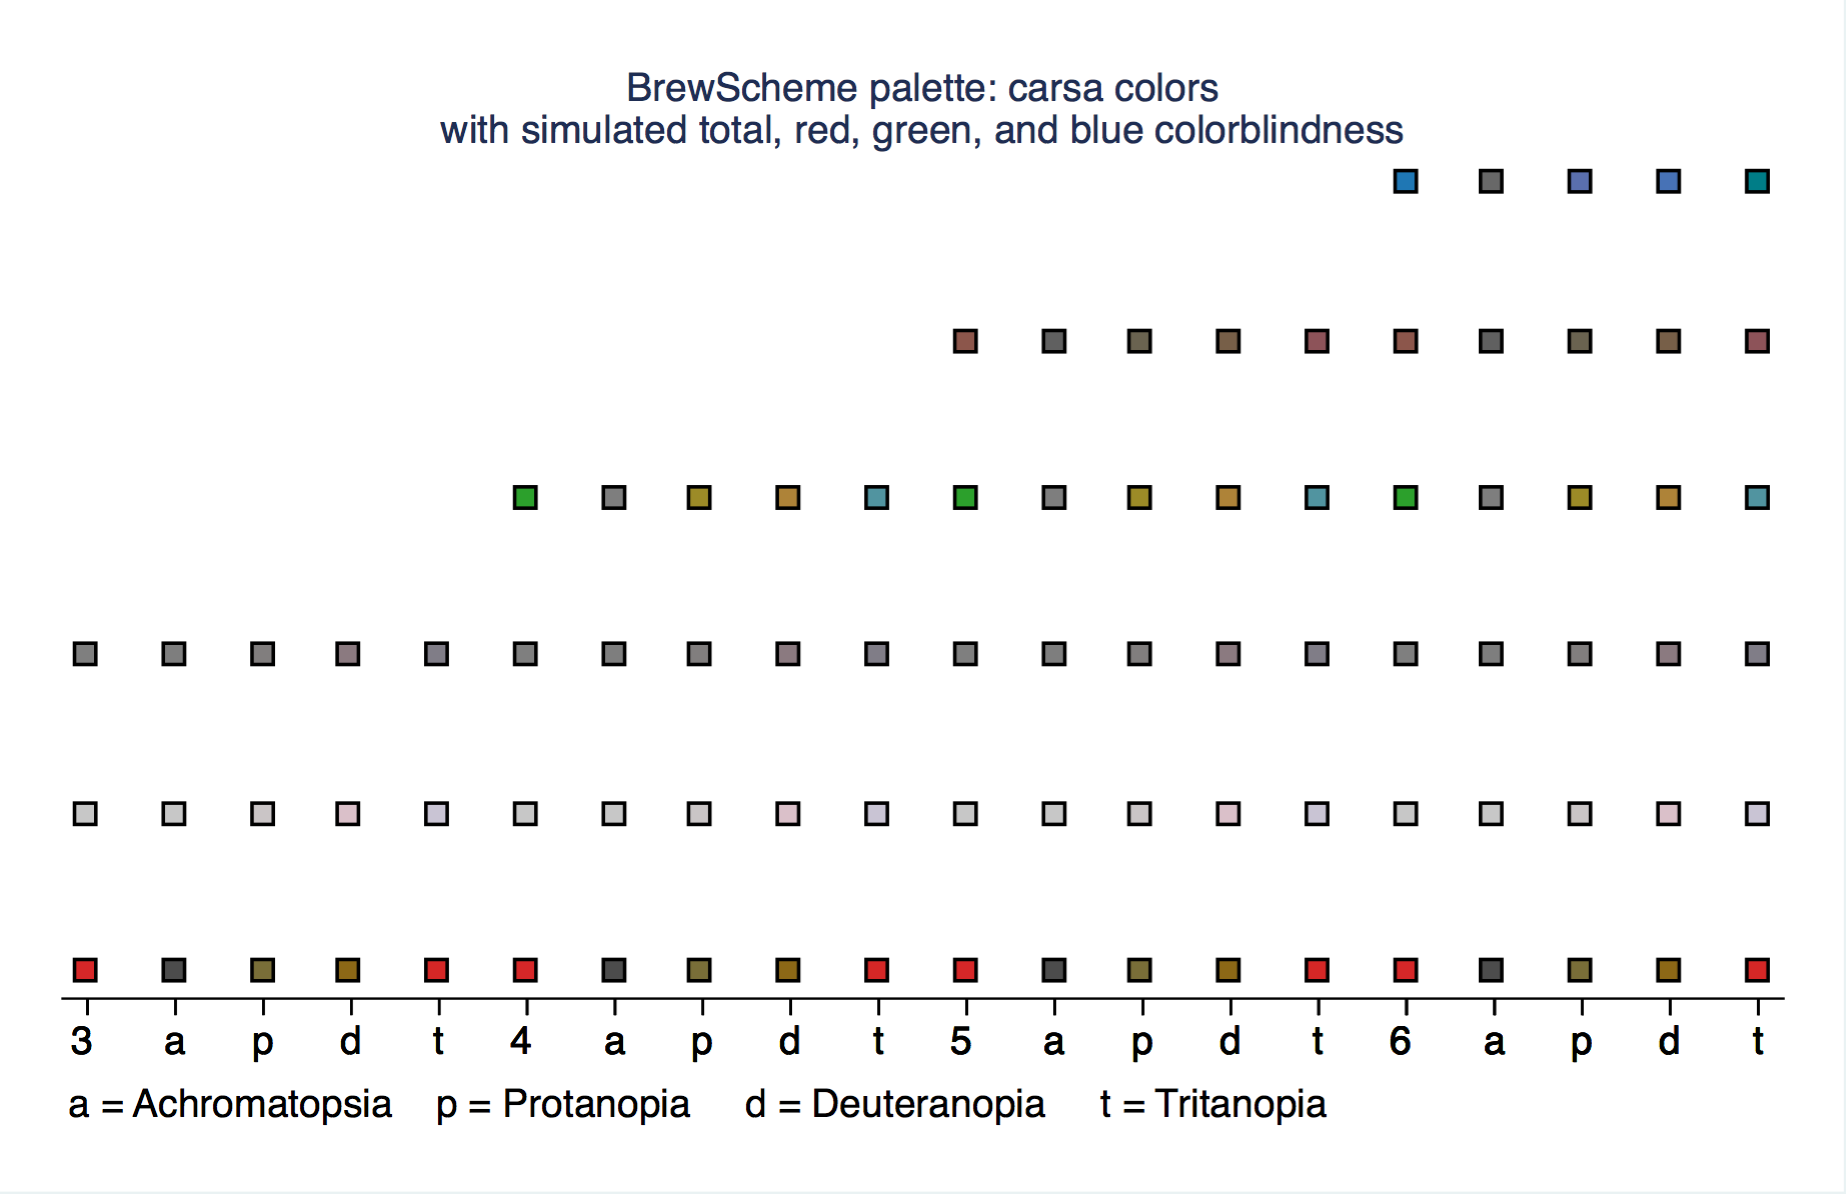 top of the gallery back to the top
carse
 top of the gallery back to the top
category10
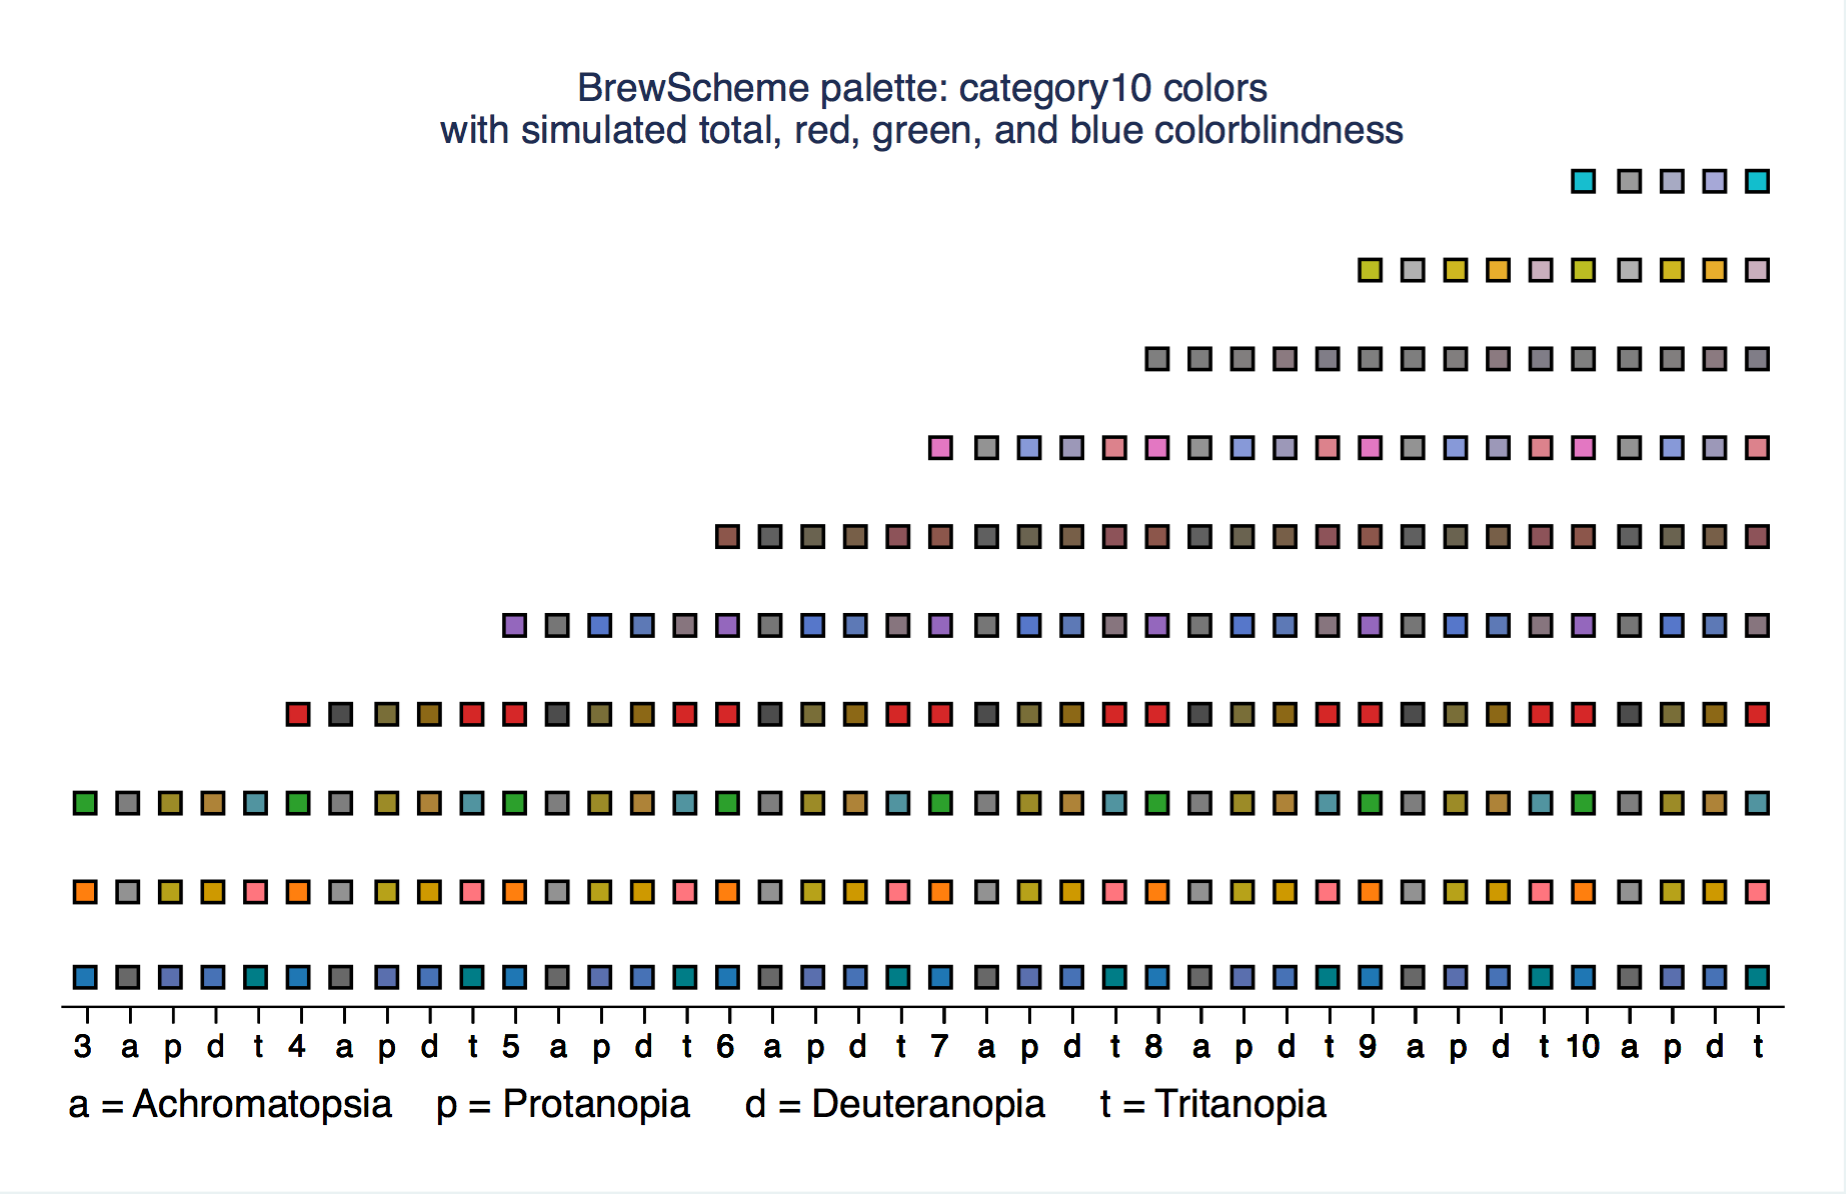 top of the gallery back to the top
category20
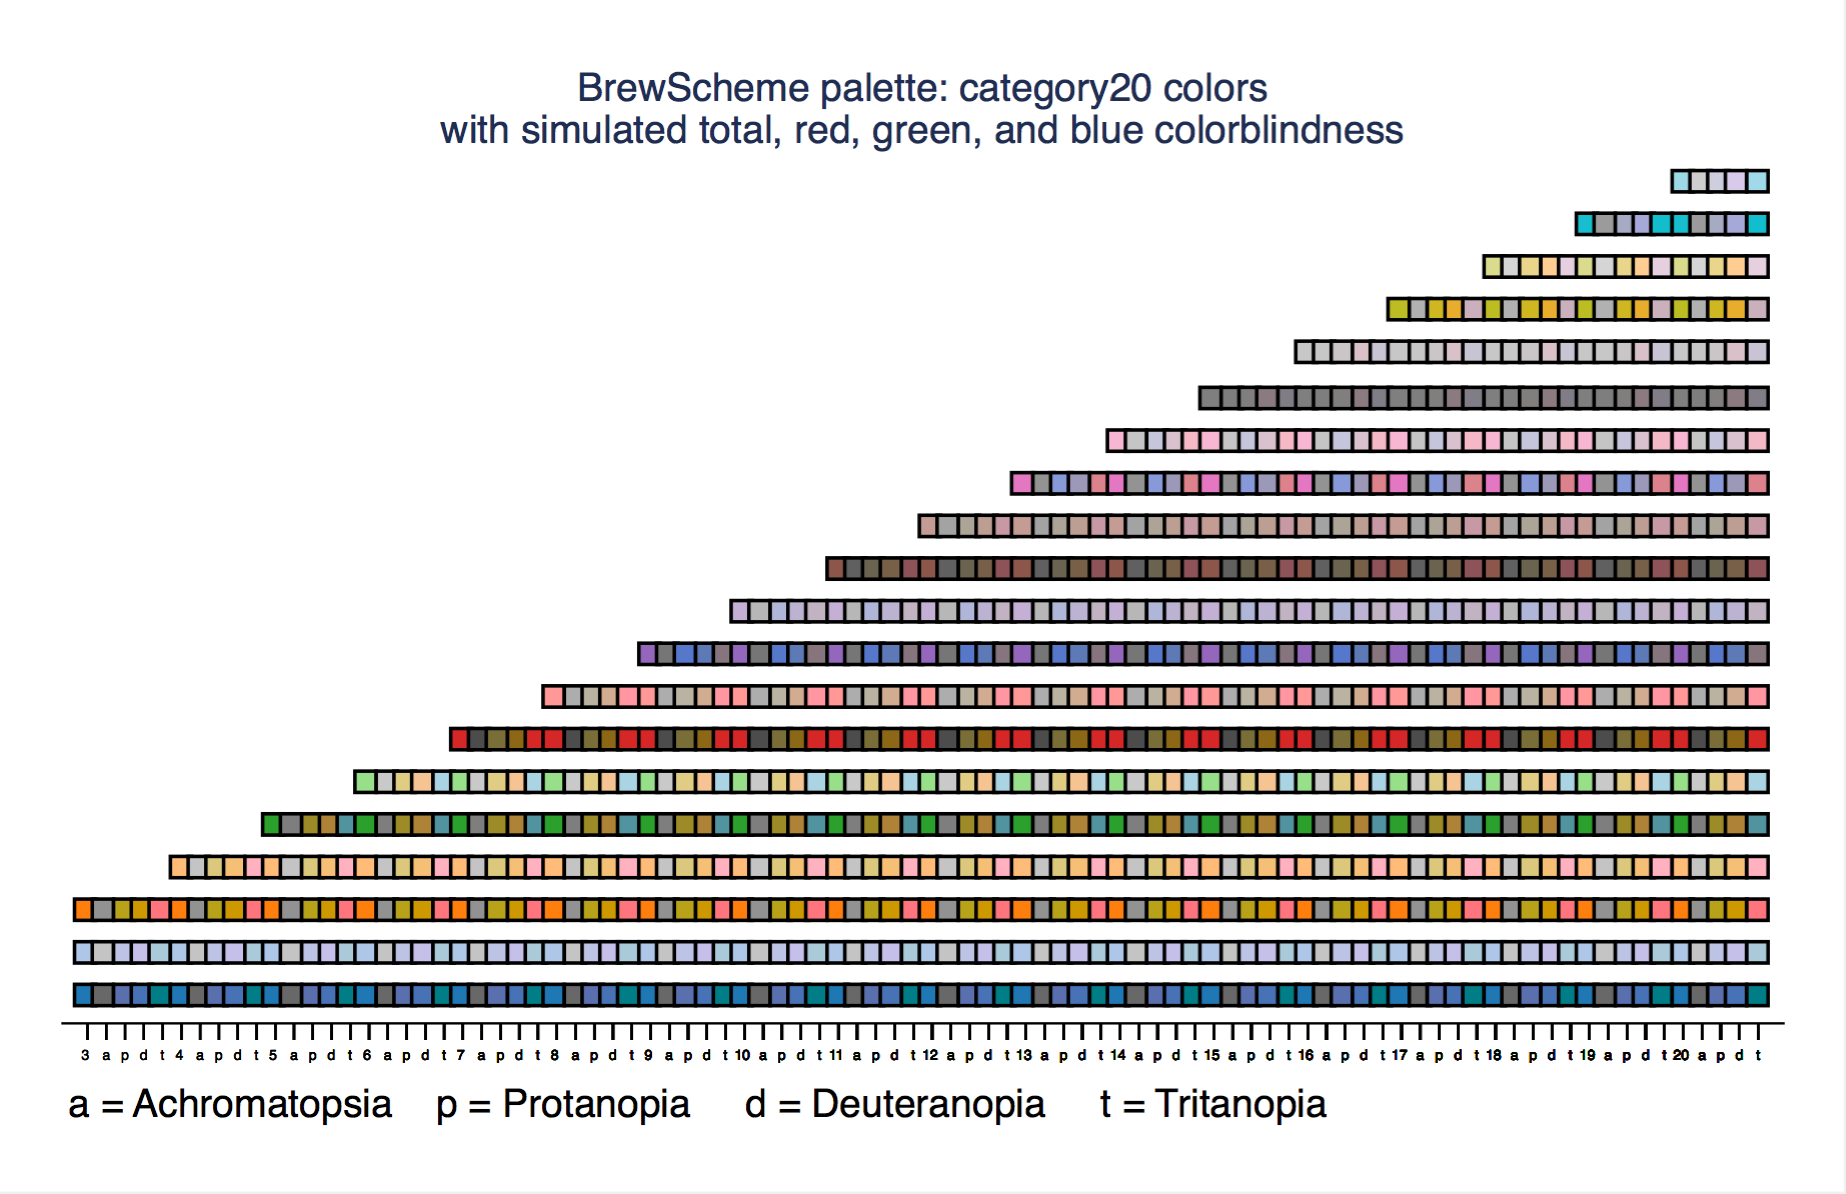 top of the gallery back to the top
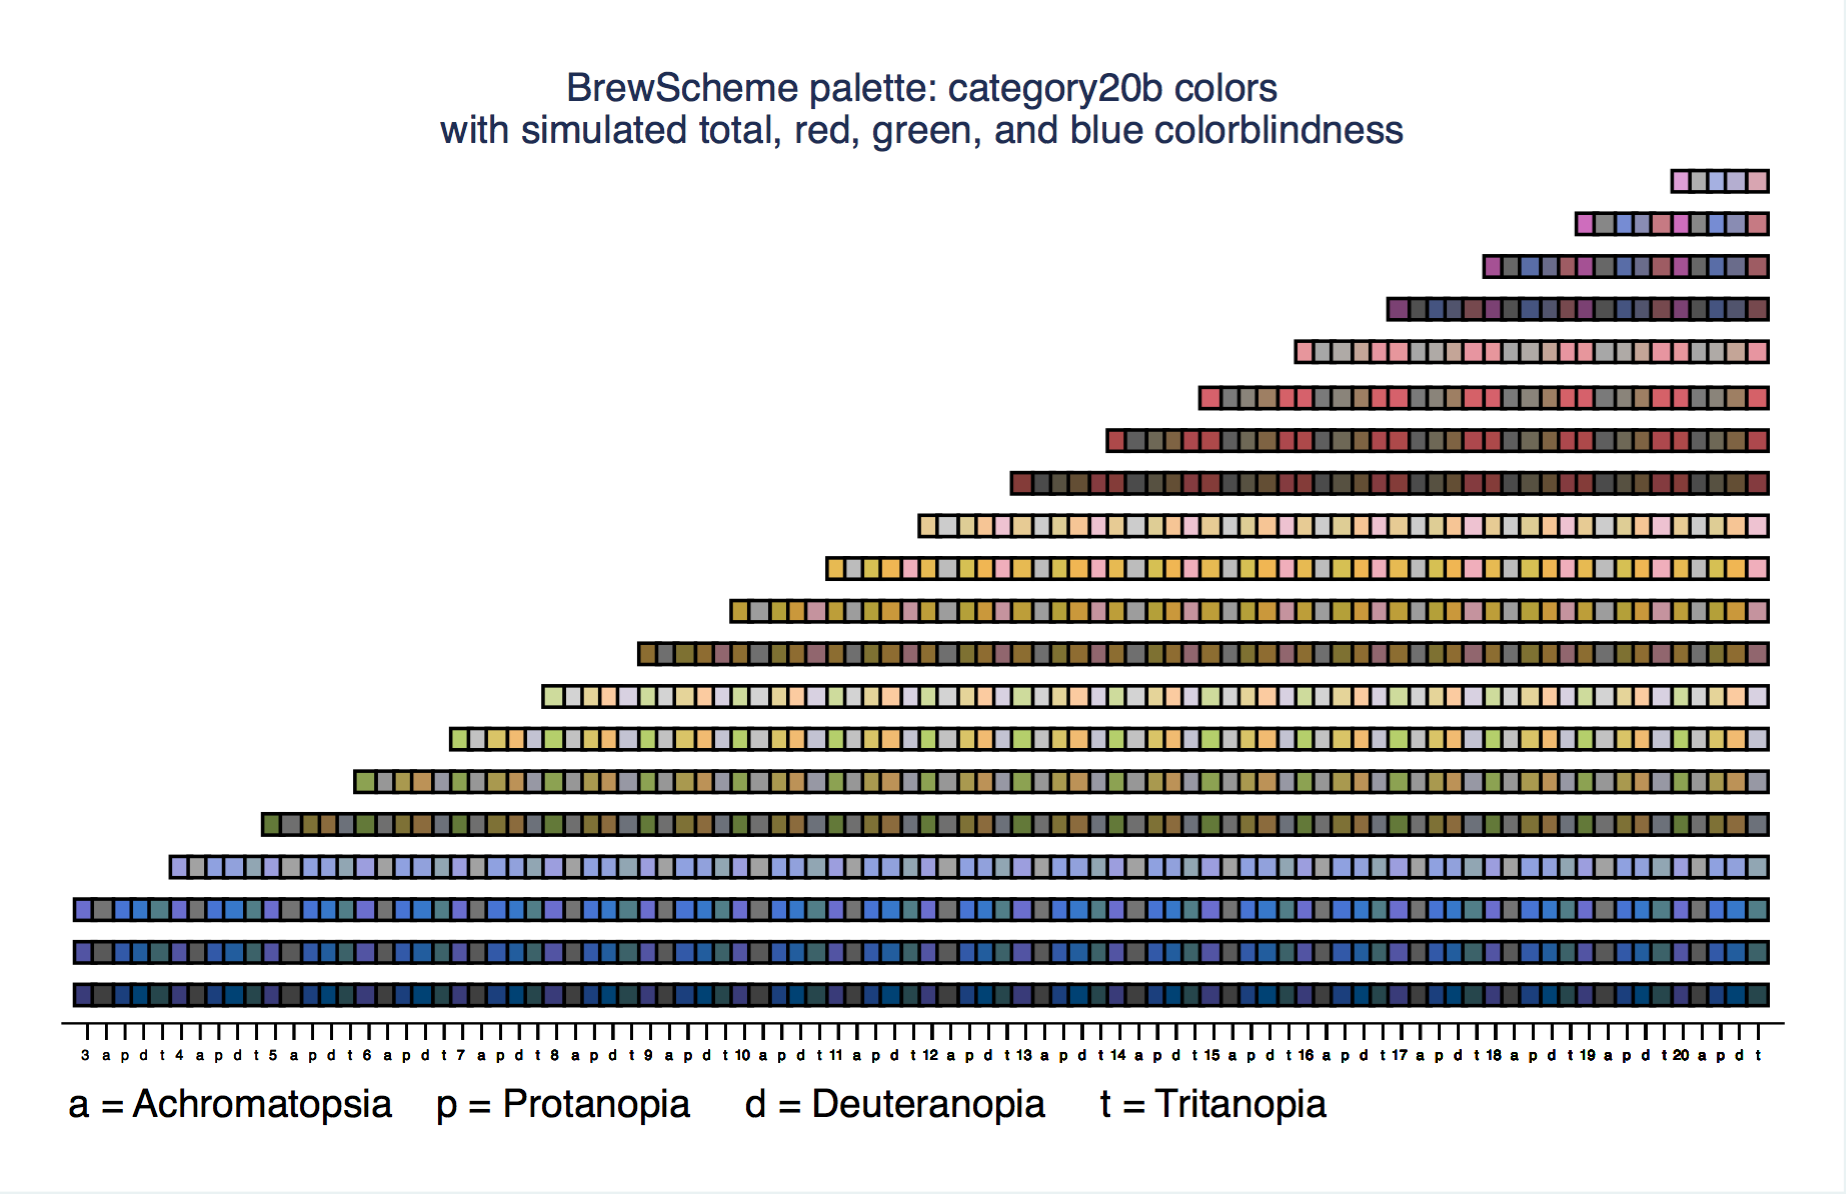
category20b
 top of the gallery back to the top
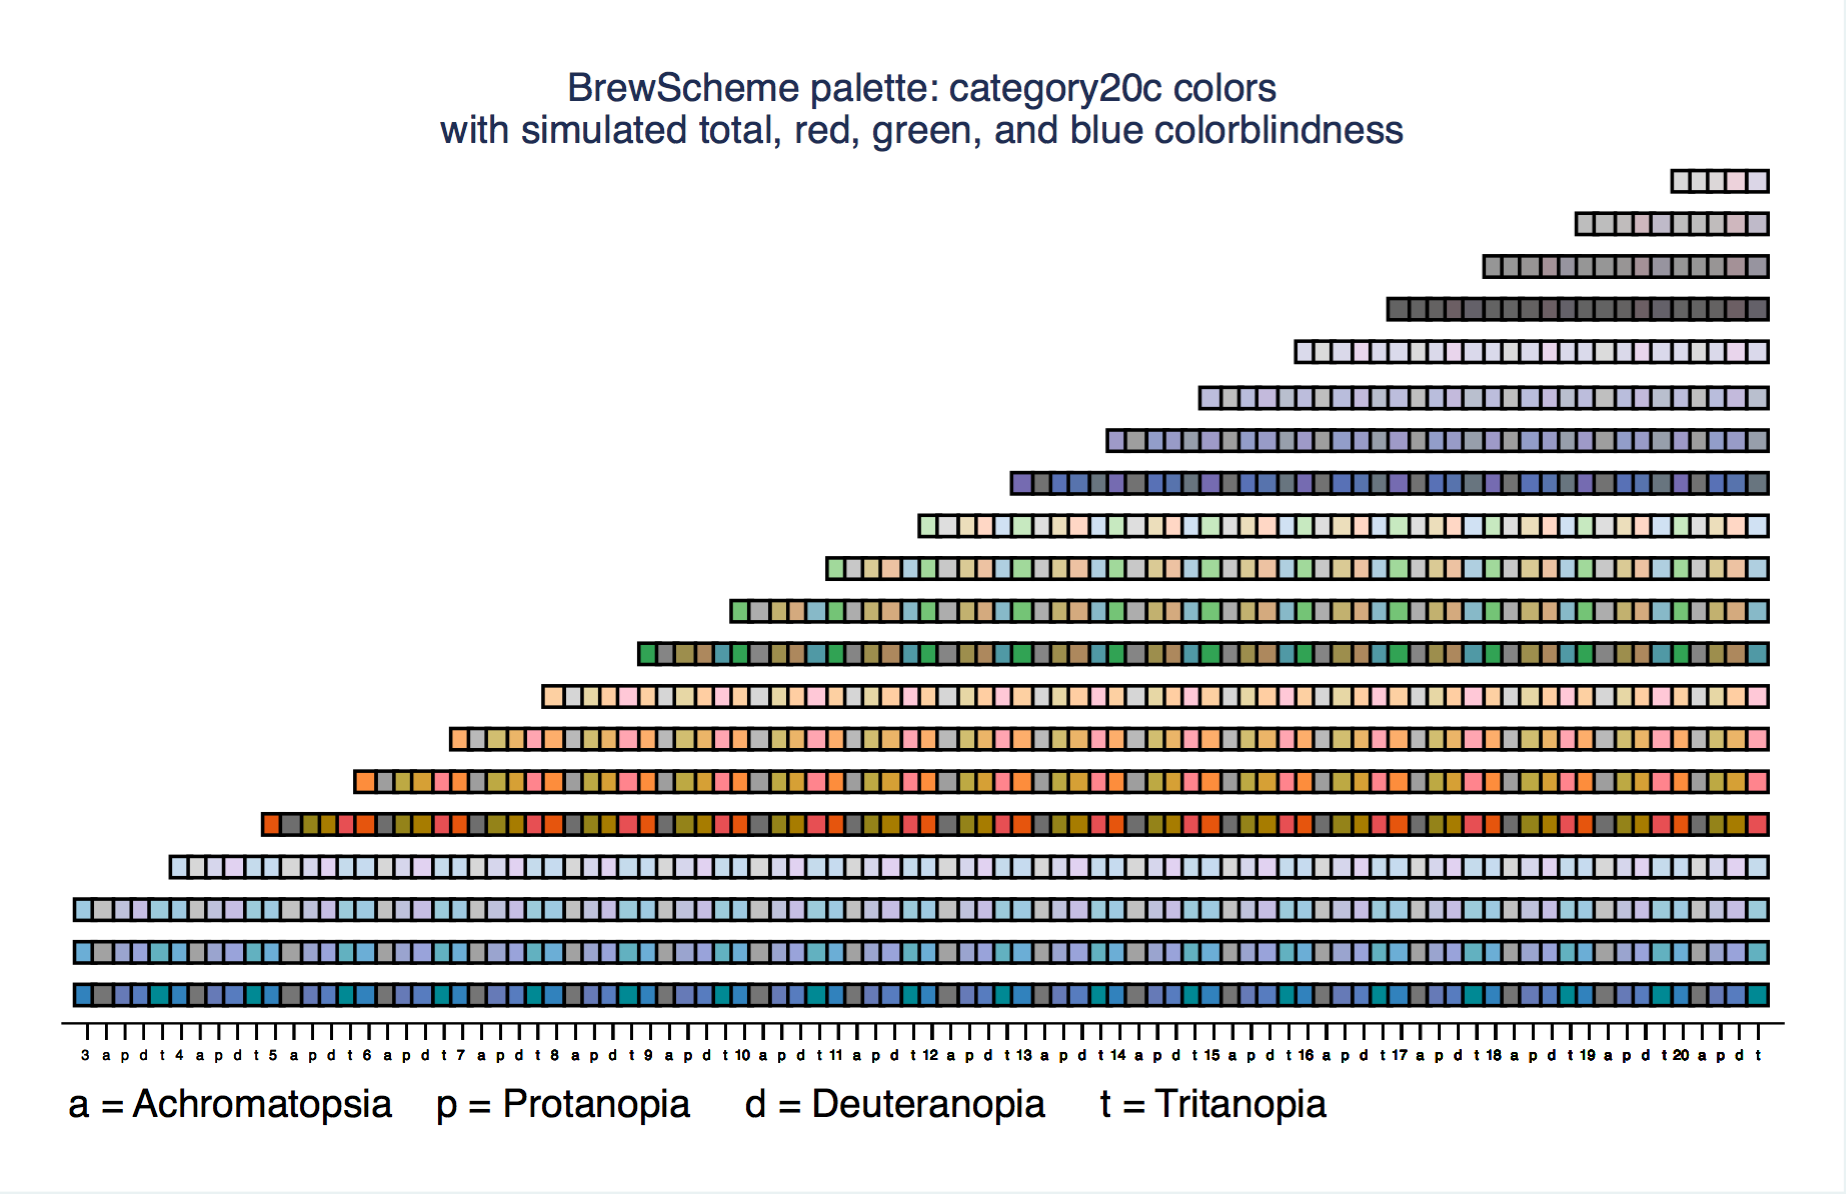
category20c
 top of the gallery back to the top
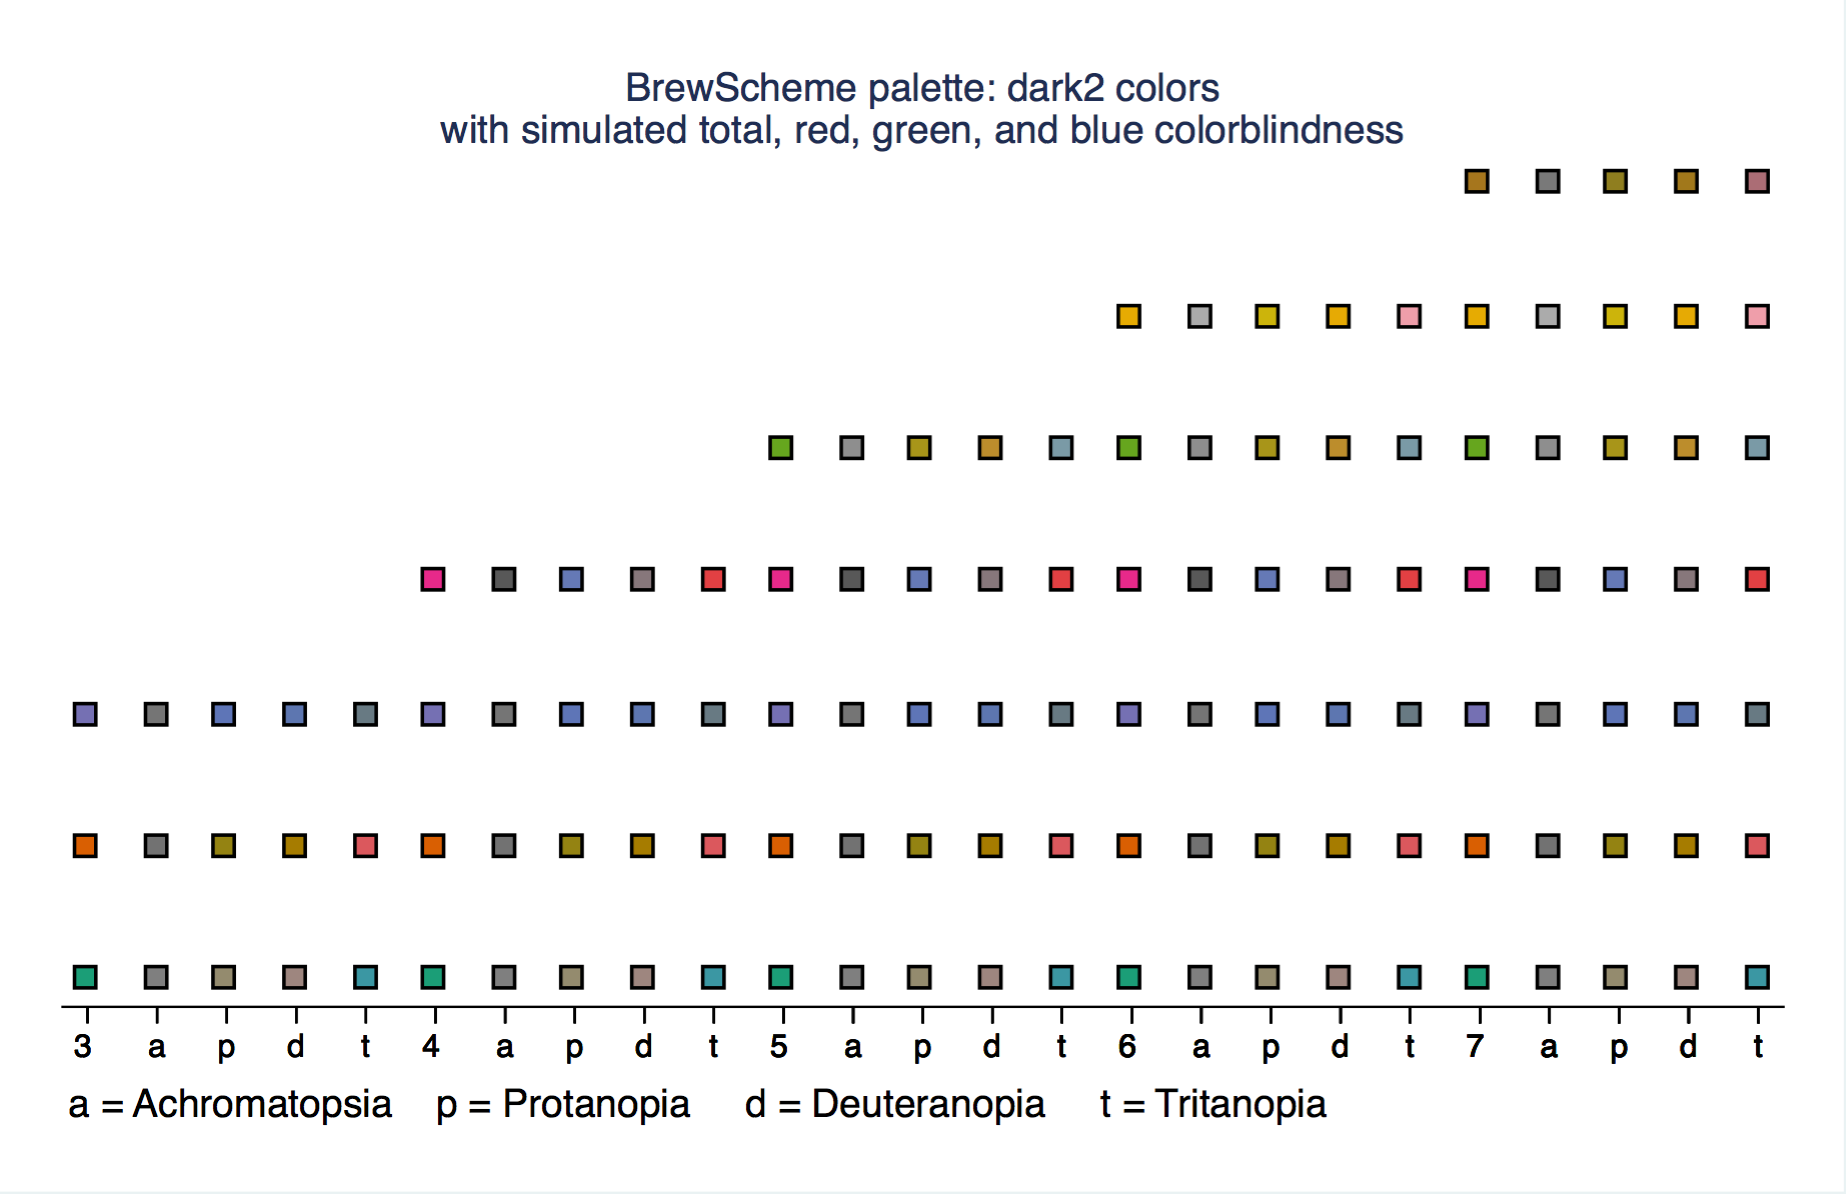
dark2
 top of the gallery back to the top
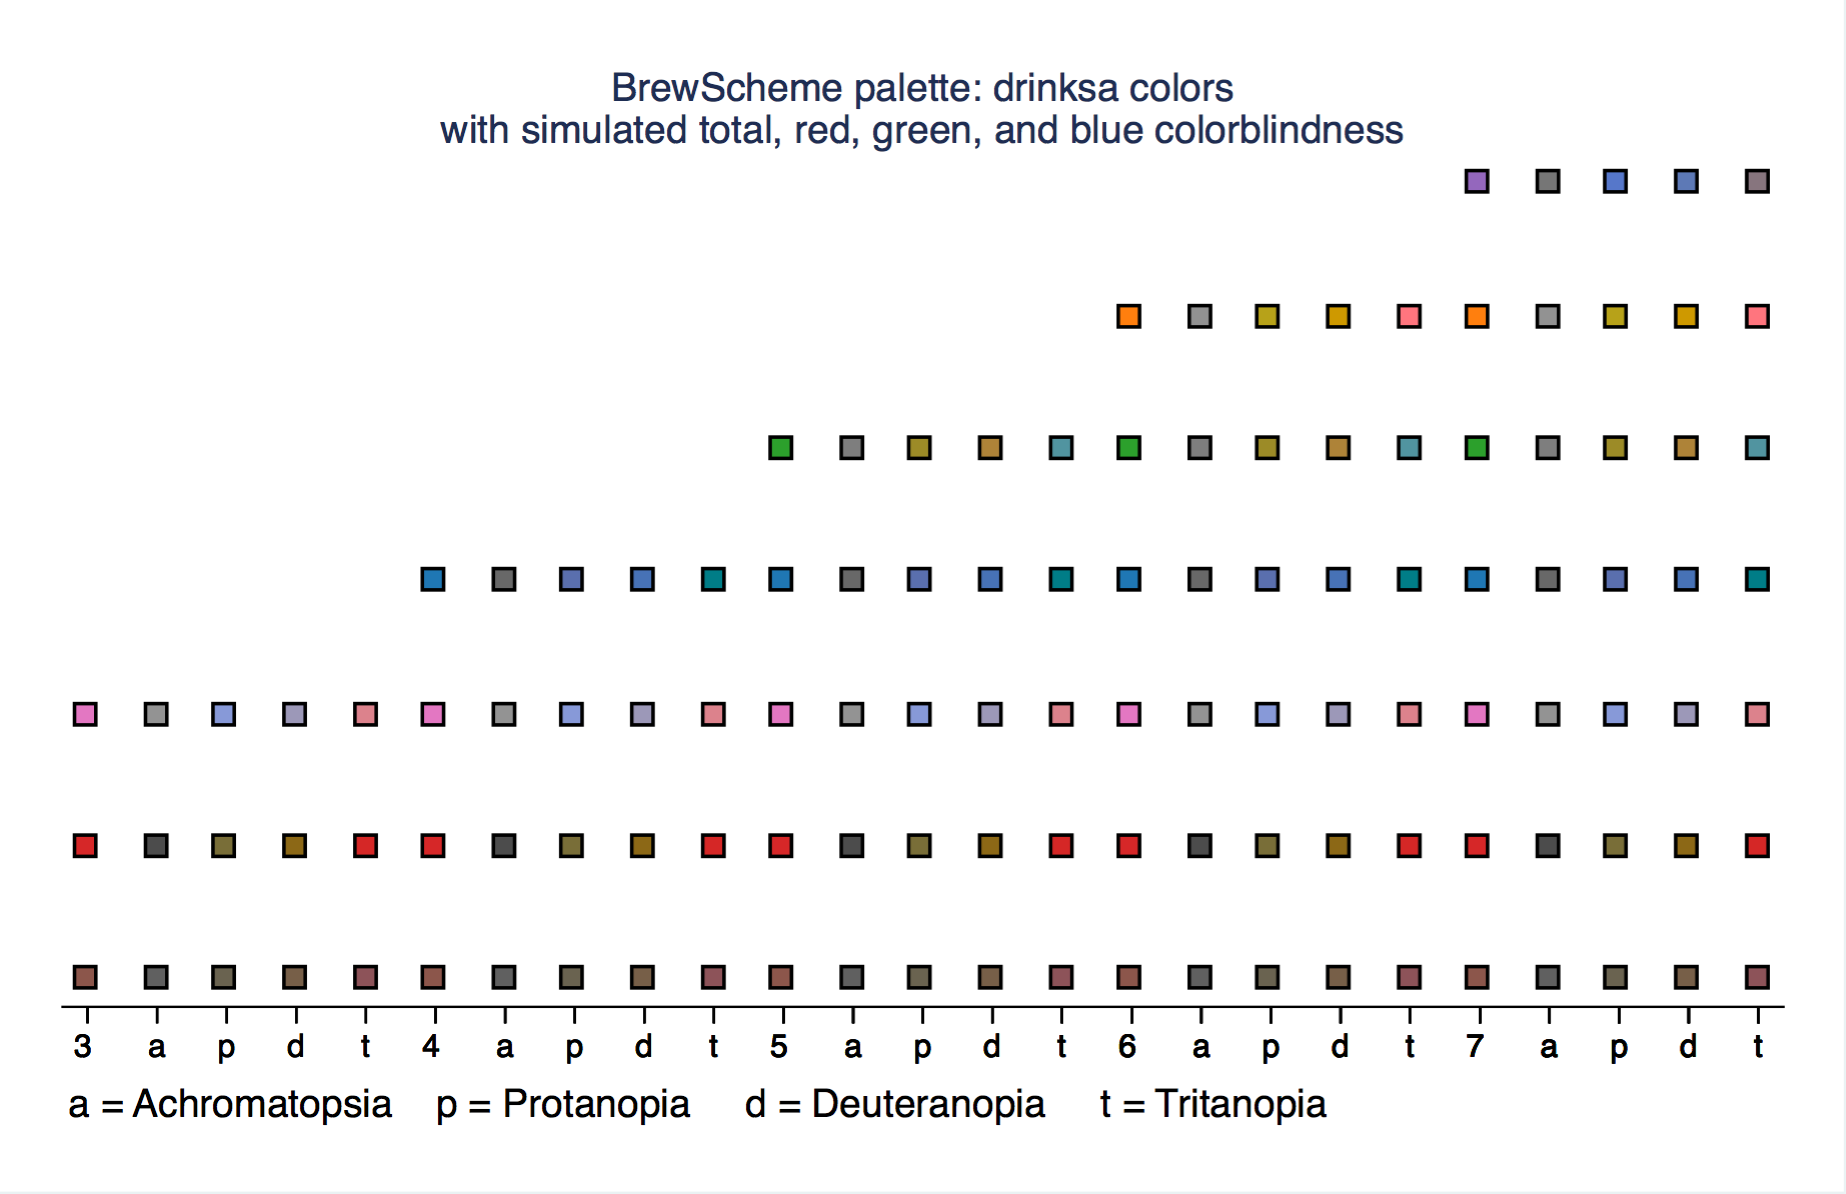
drinksa
 top of the gallery back to the top
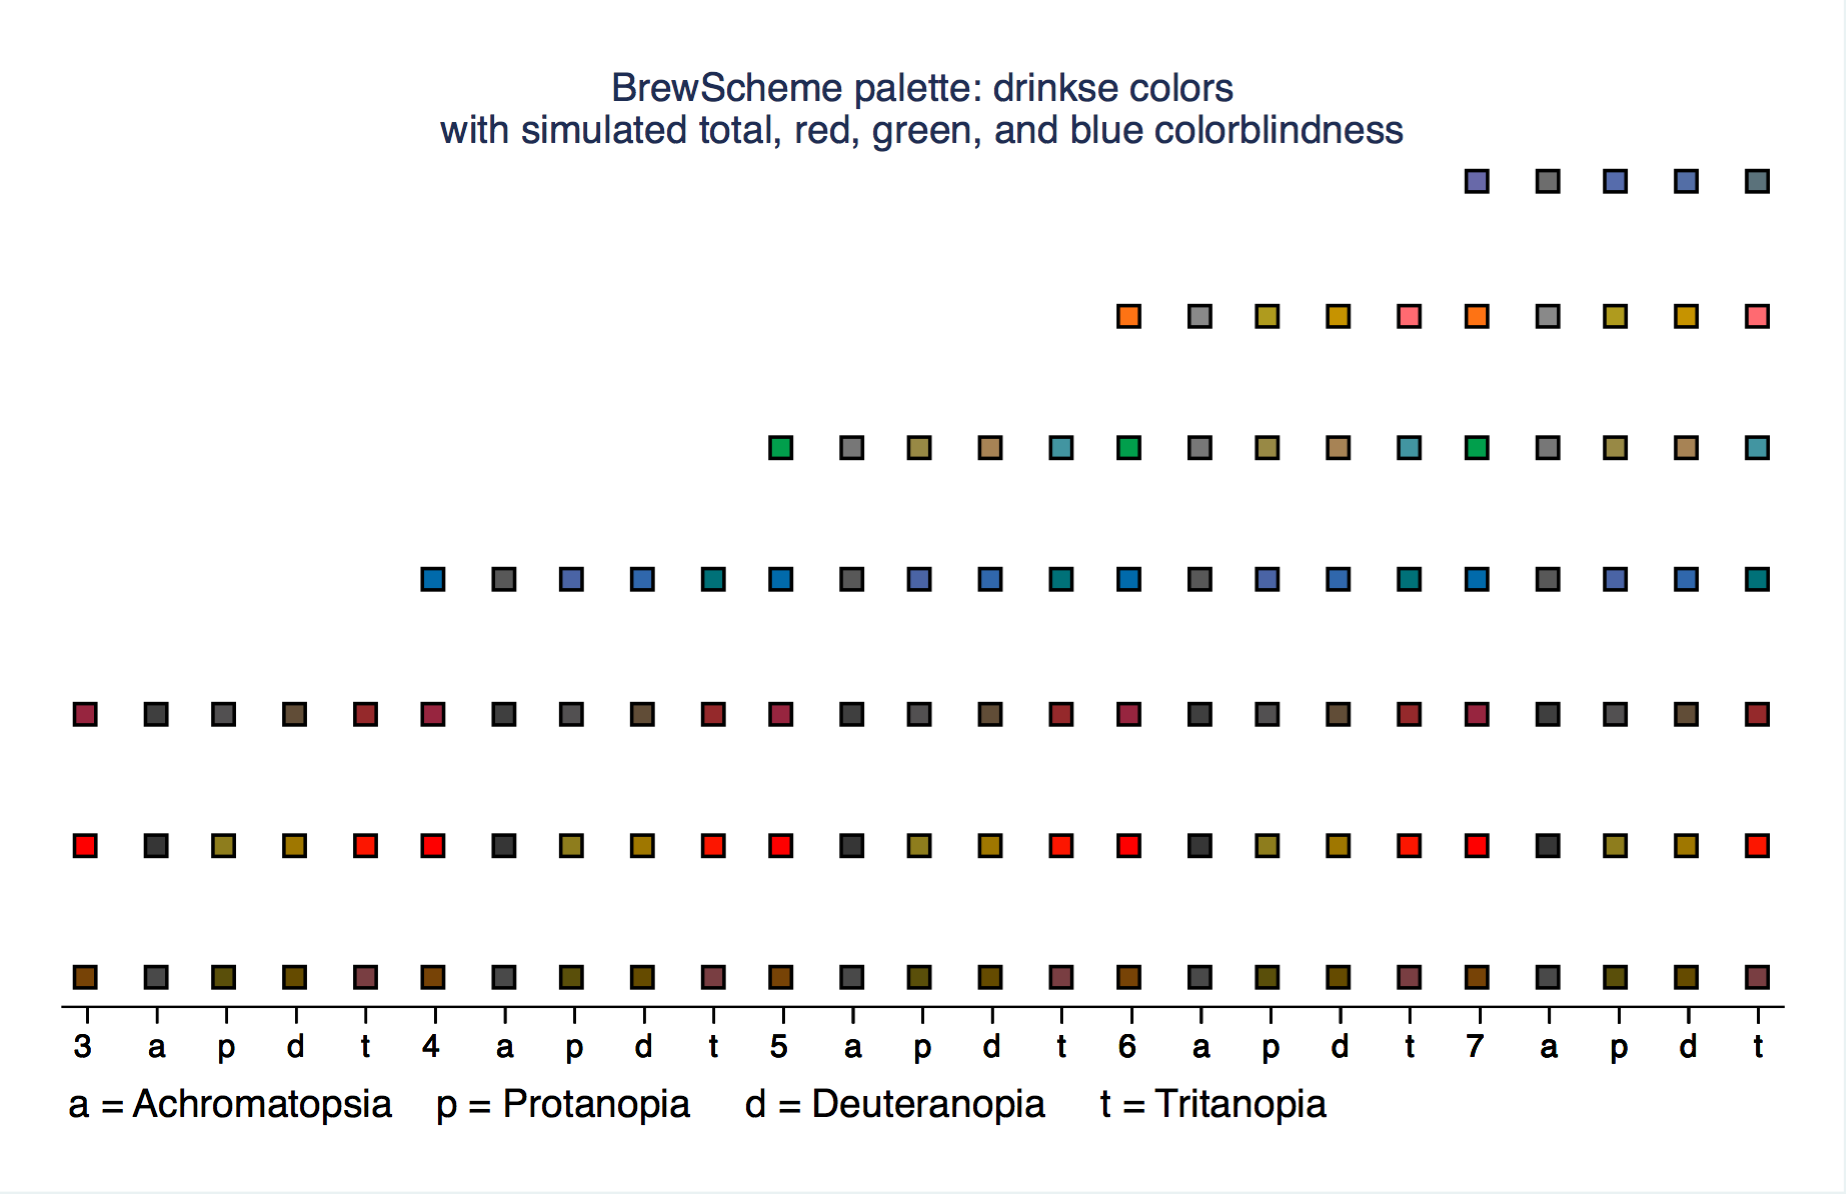
drinkse
 top of the gallery back to the top
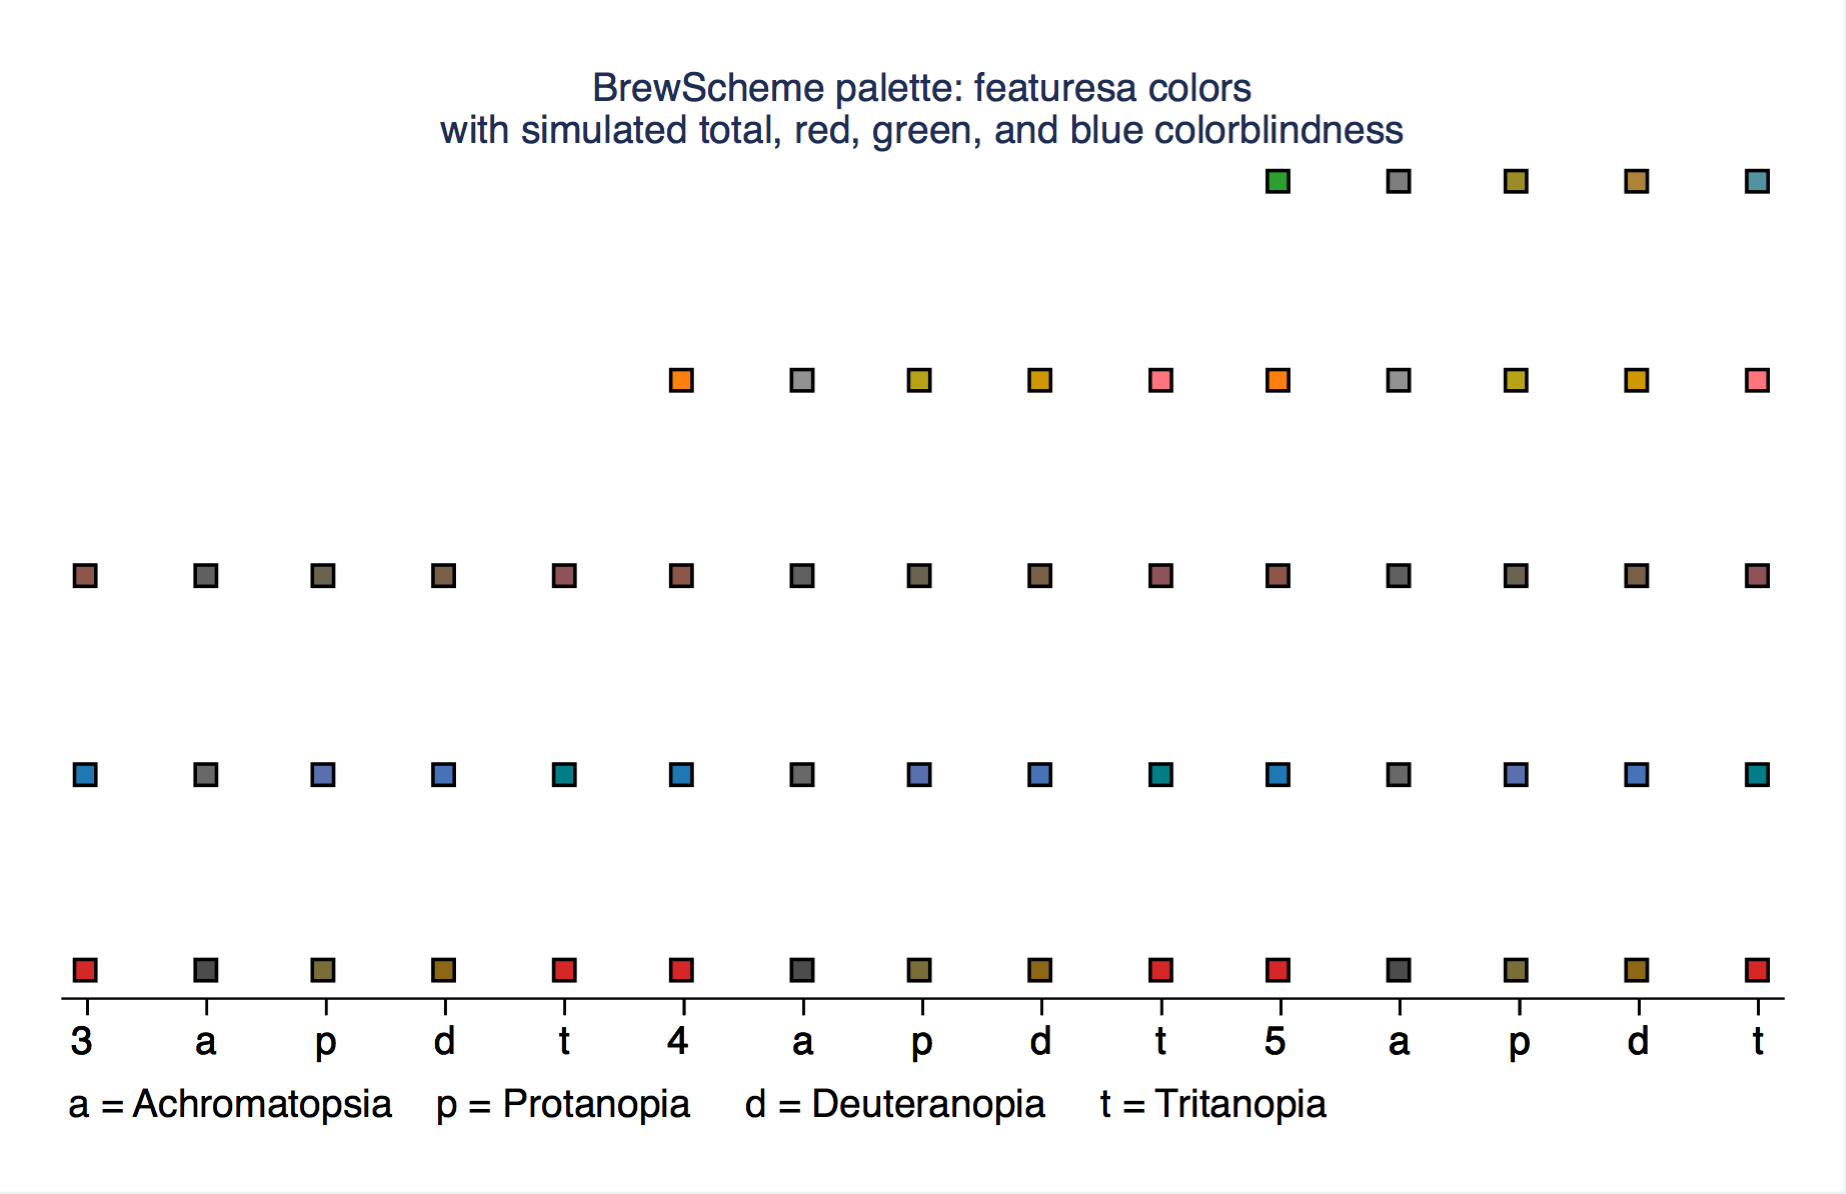
featuresa
 top of the gallery back to the top
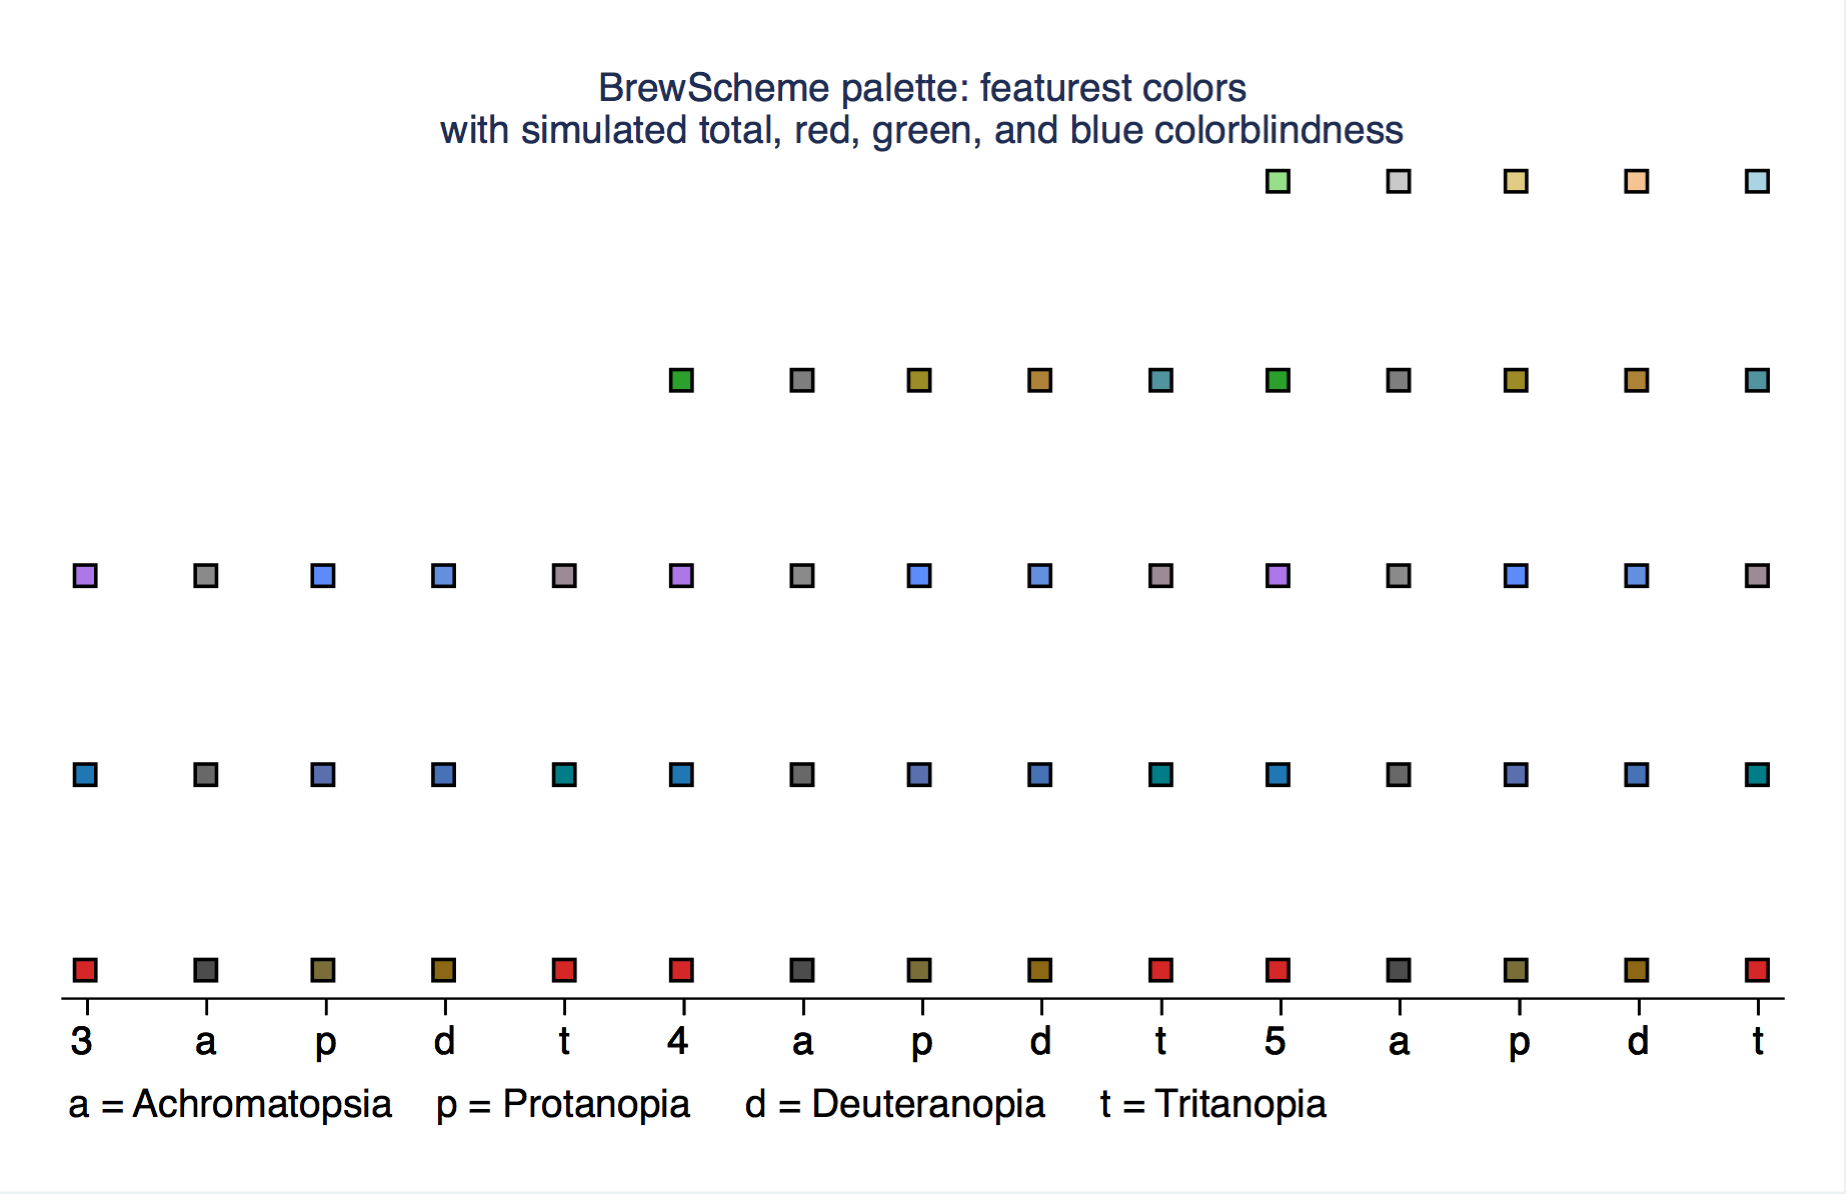
featurest
 top of the gallery back to the top
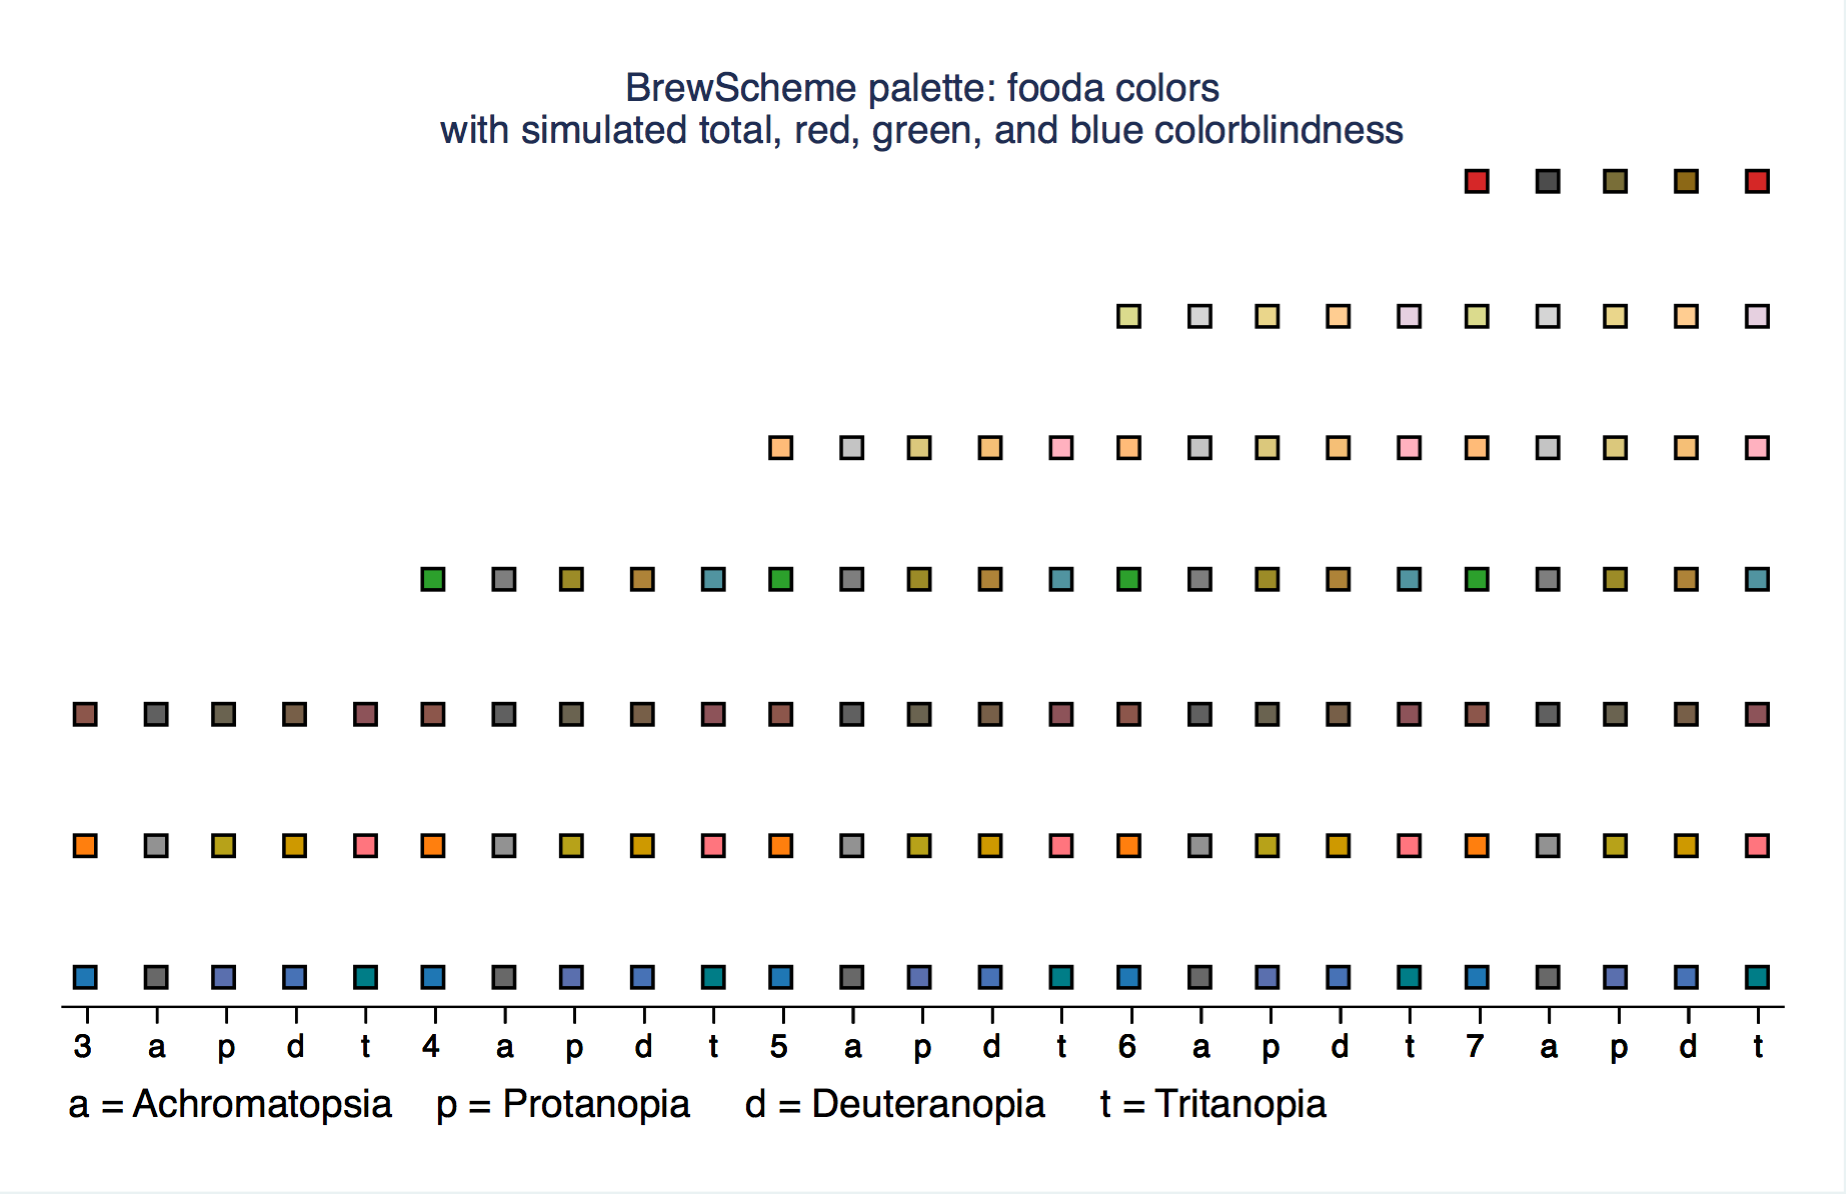
fooda
 top of the gallery back to the top
foode
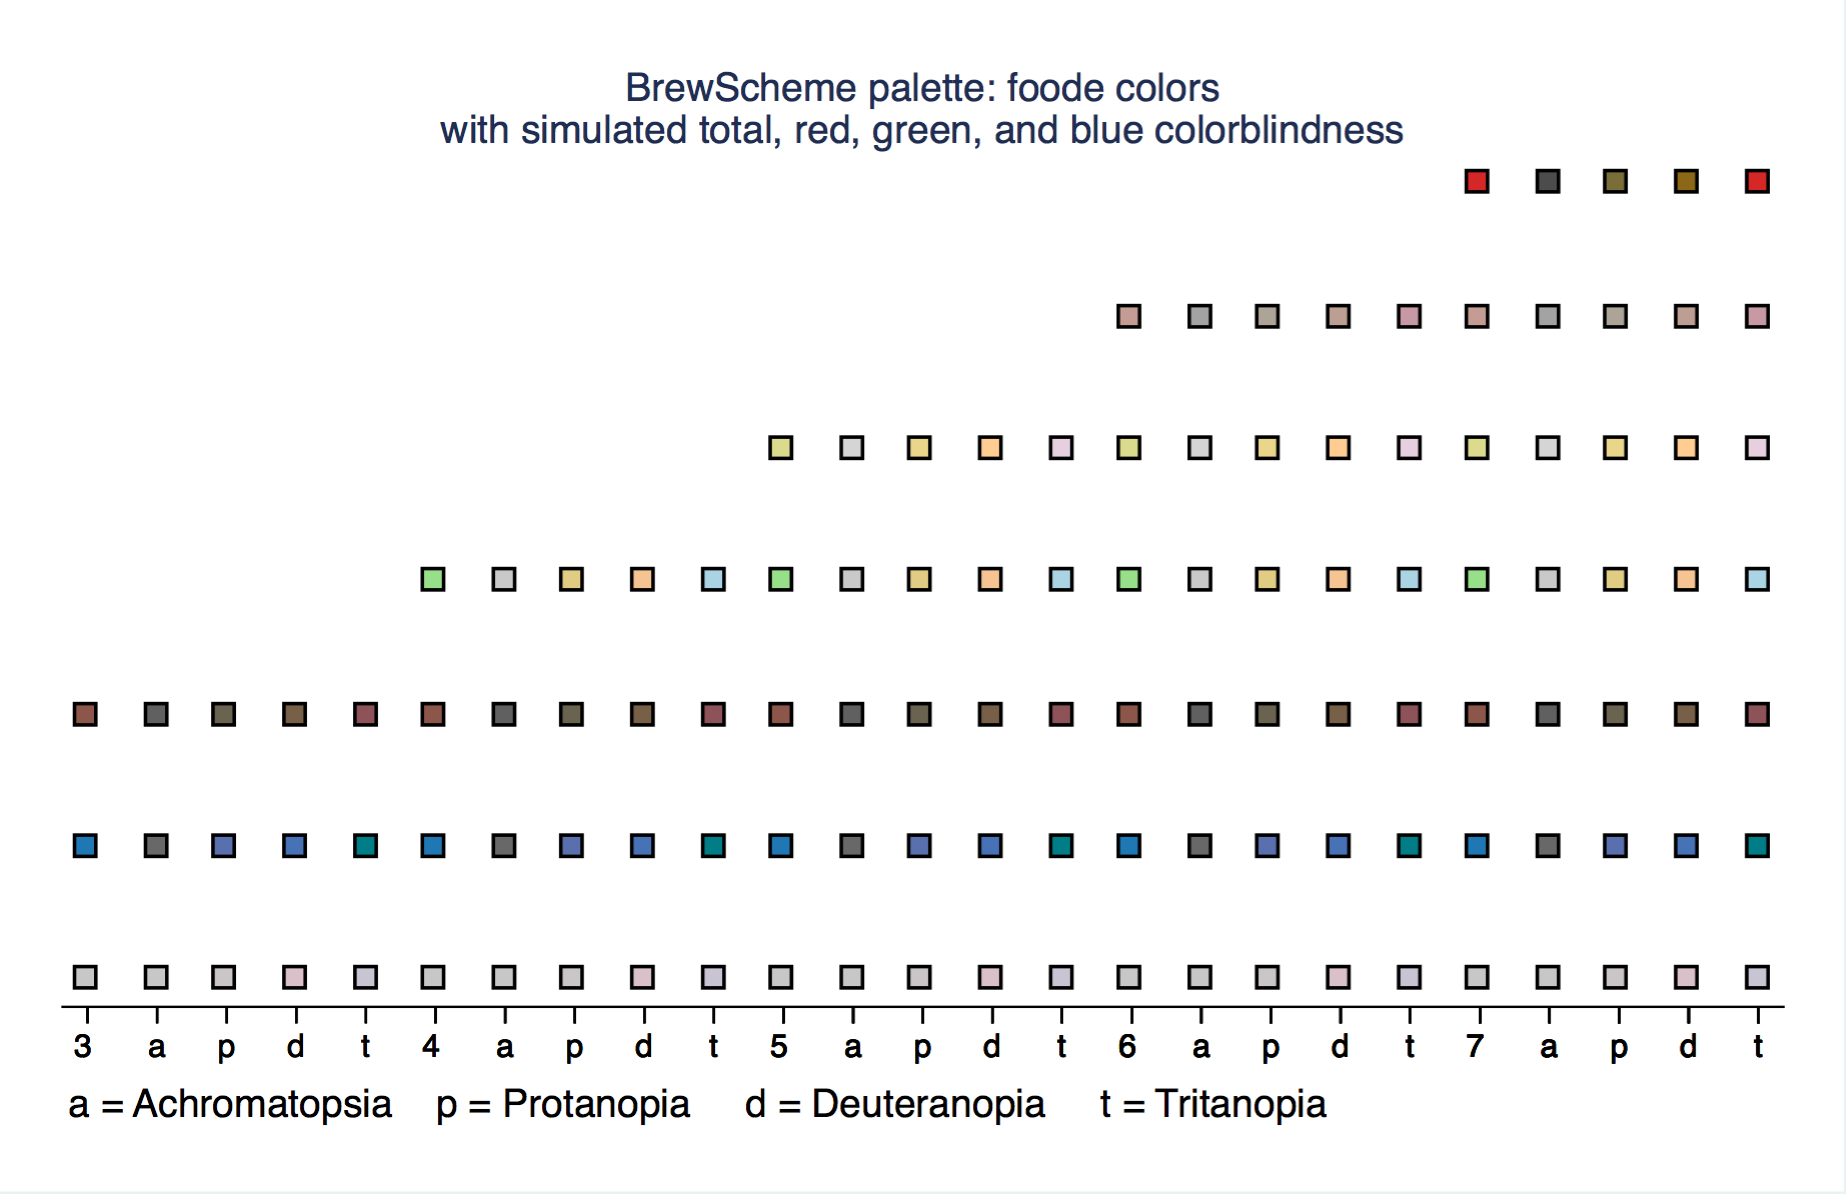 top of the gallery back to the top
fruita
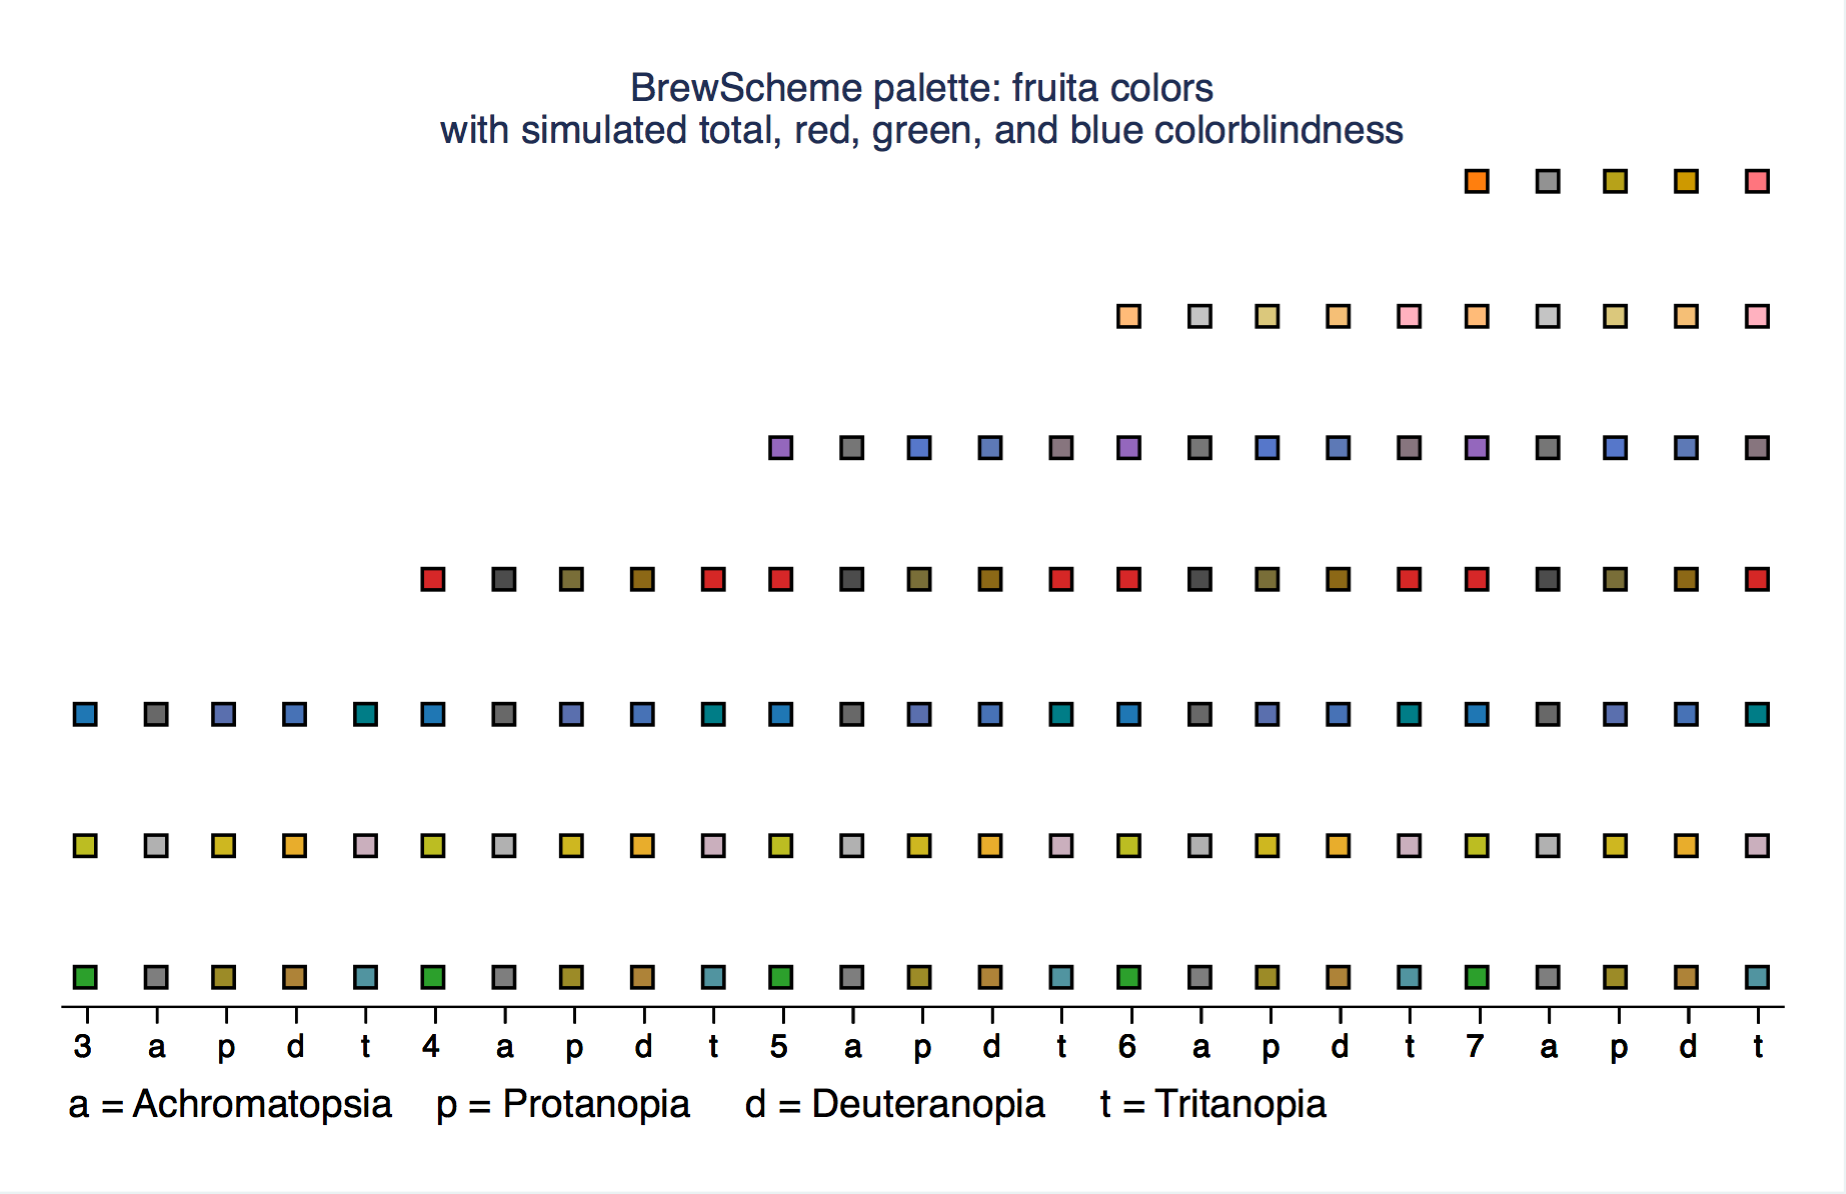 top of the gallery back to the top
fruite
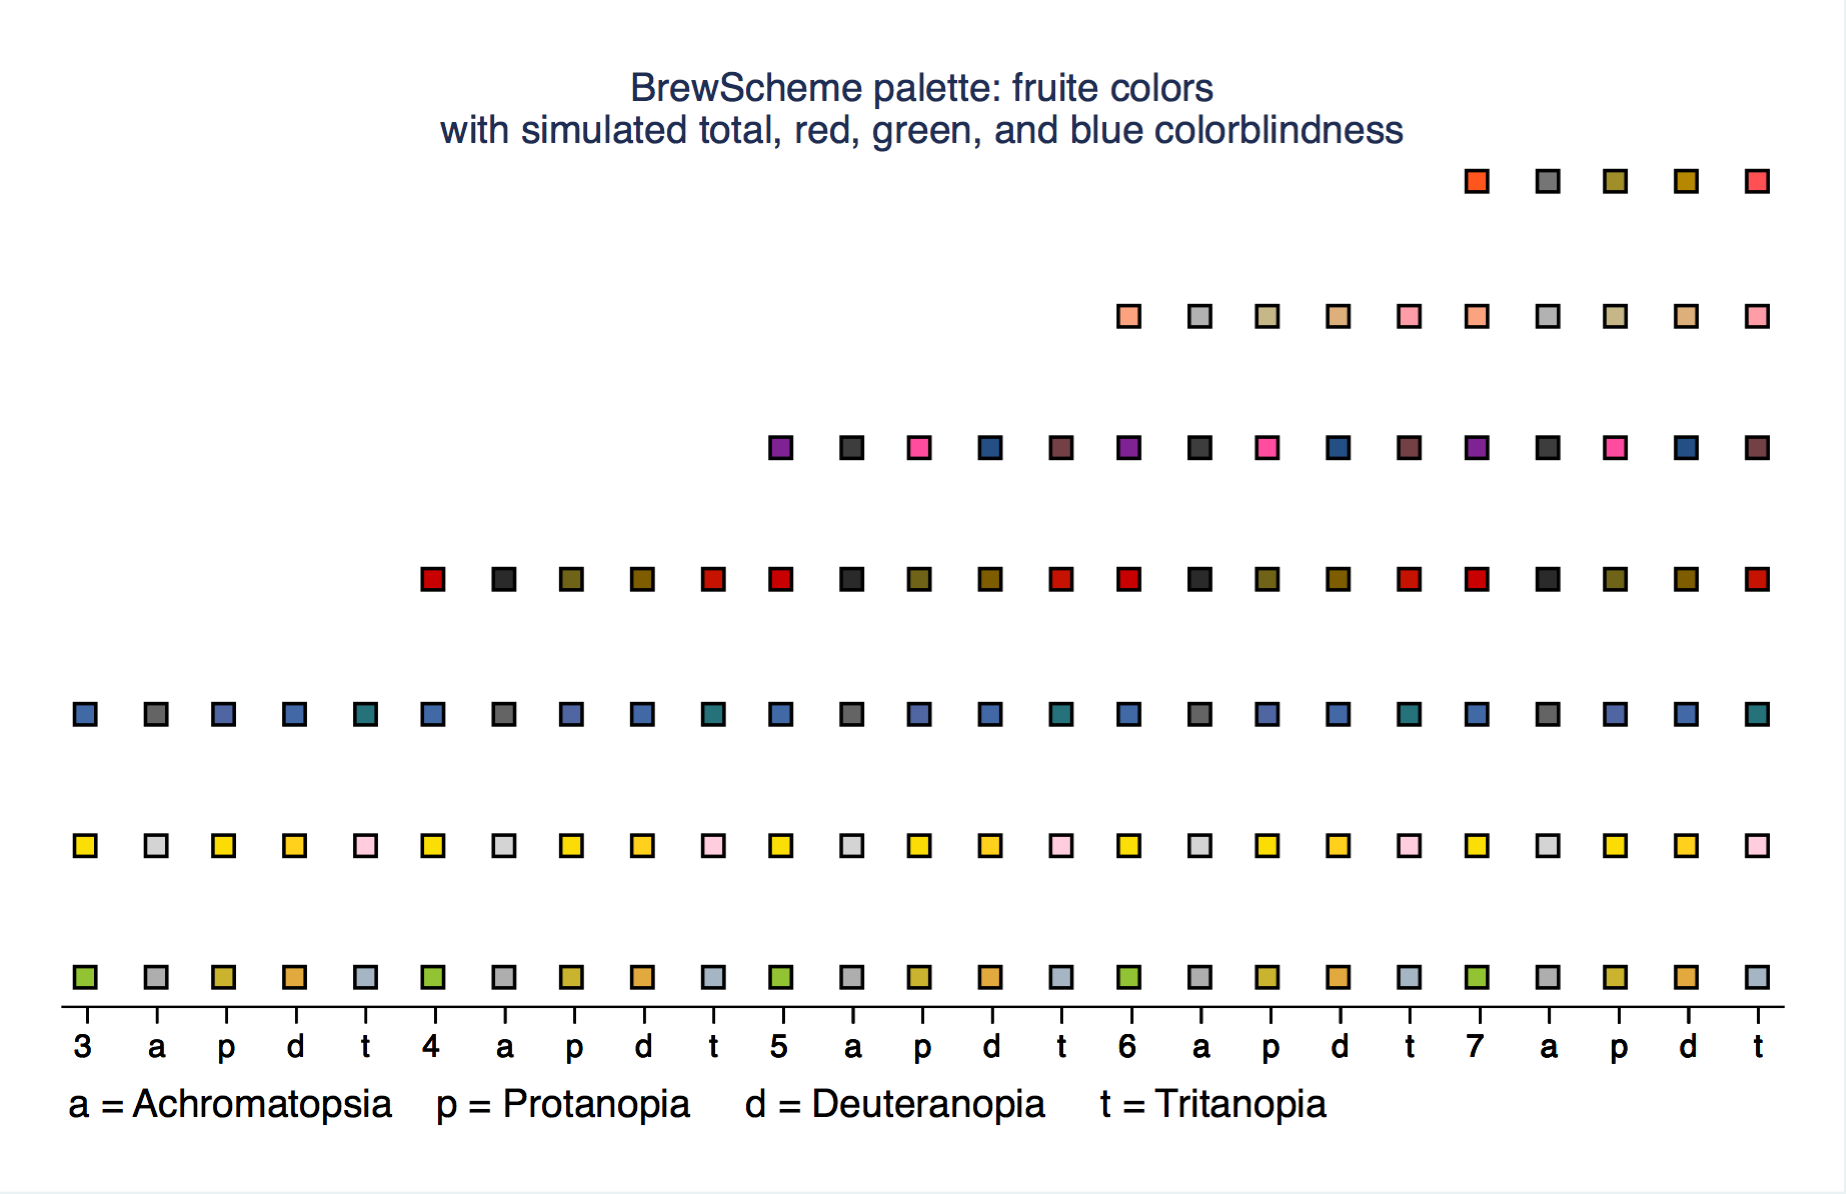 top of the gallery back to the top
ggplot2
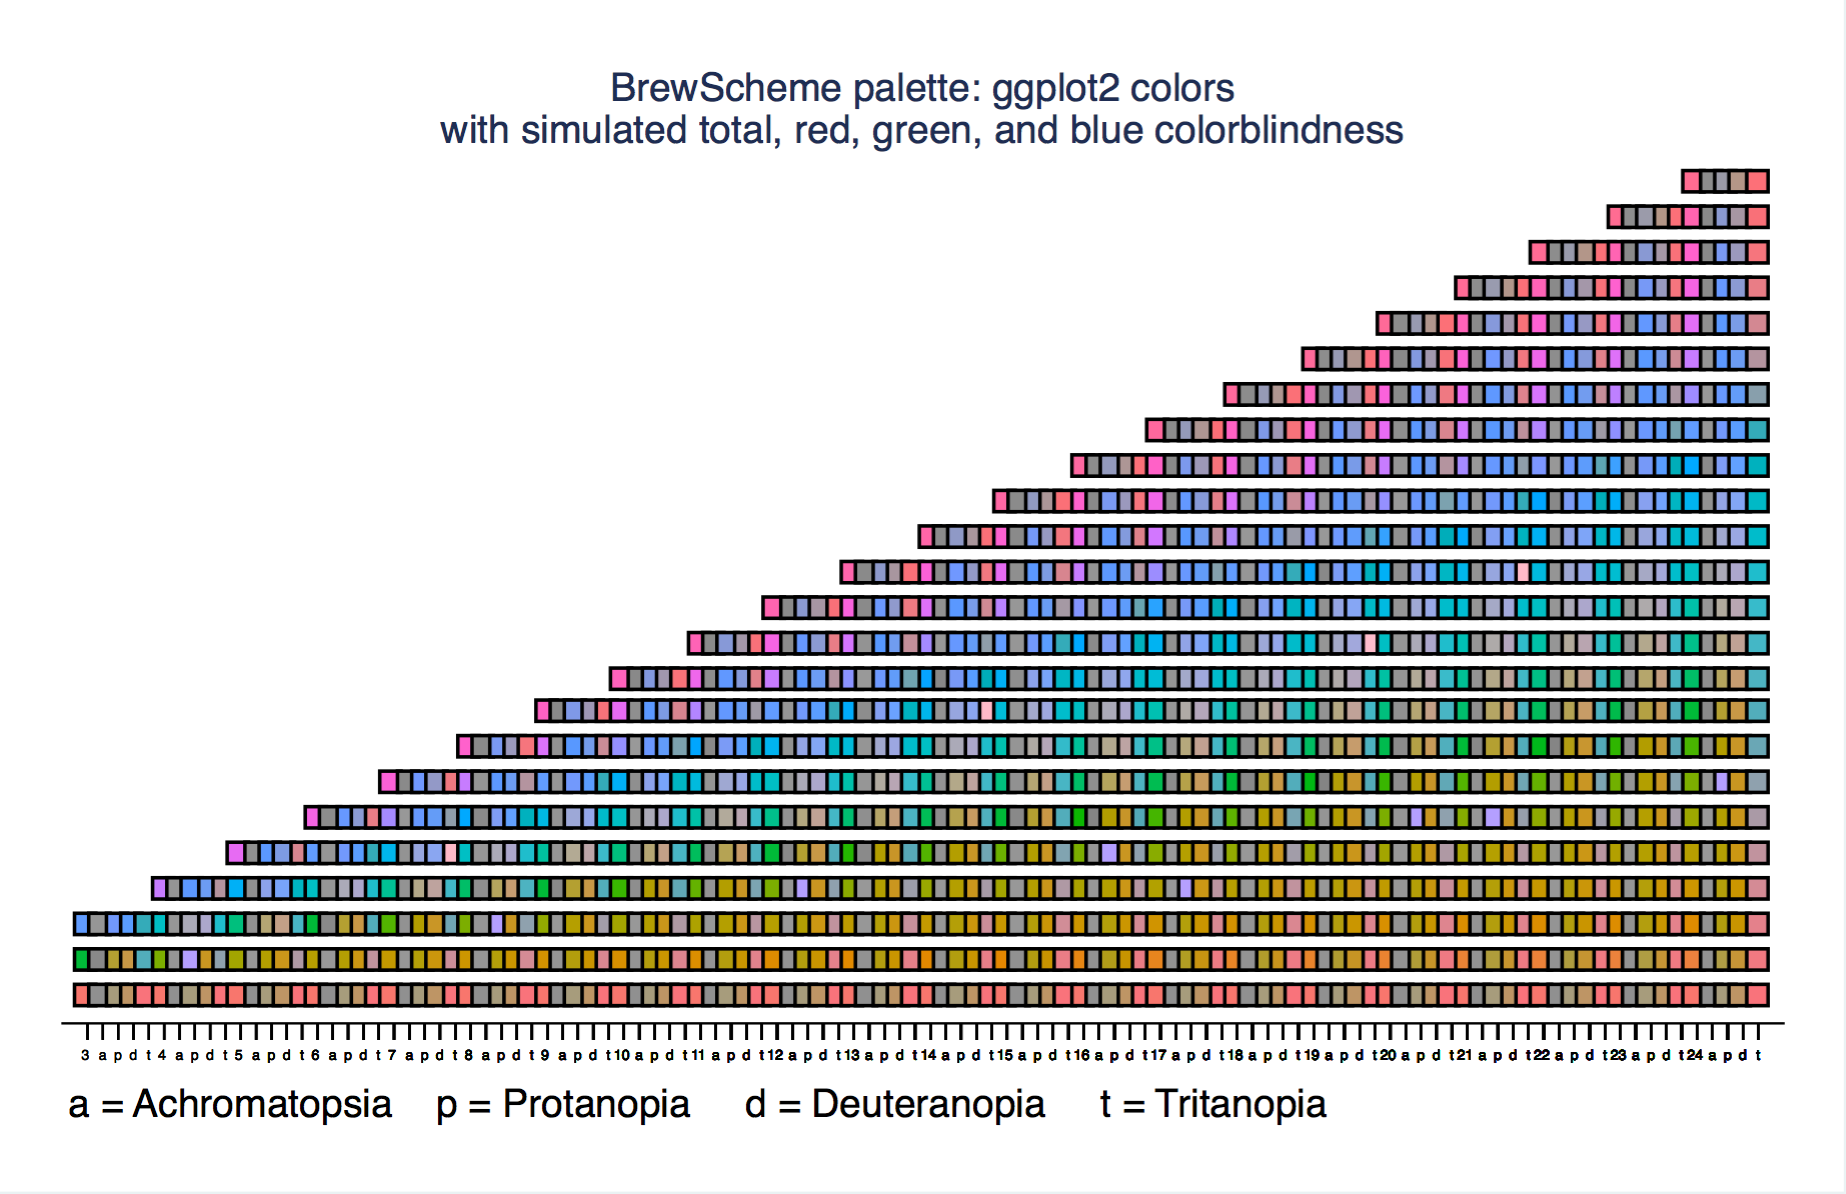 top of the gallery back to the top
gnbu
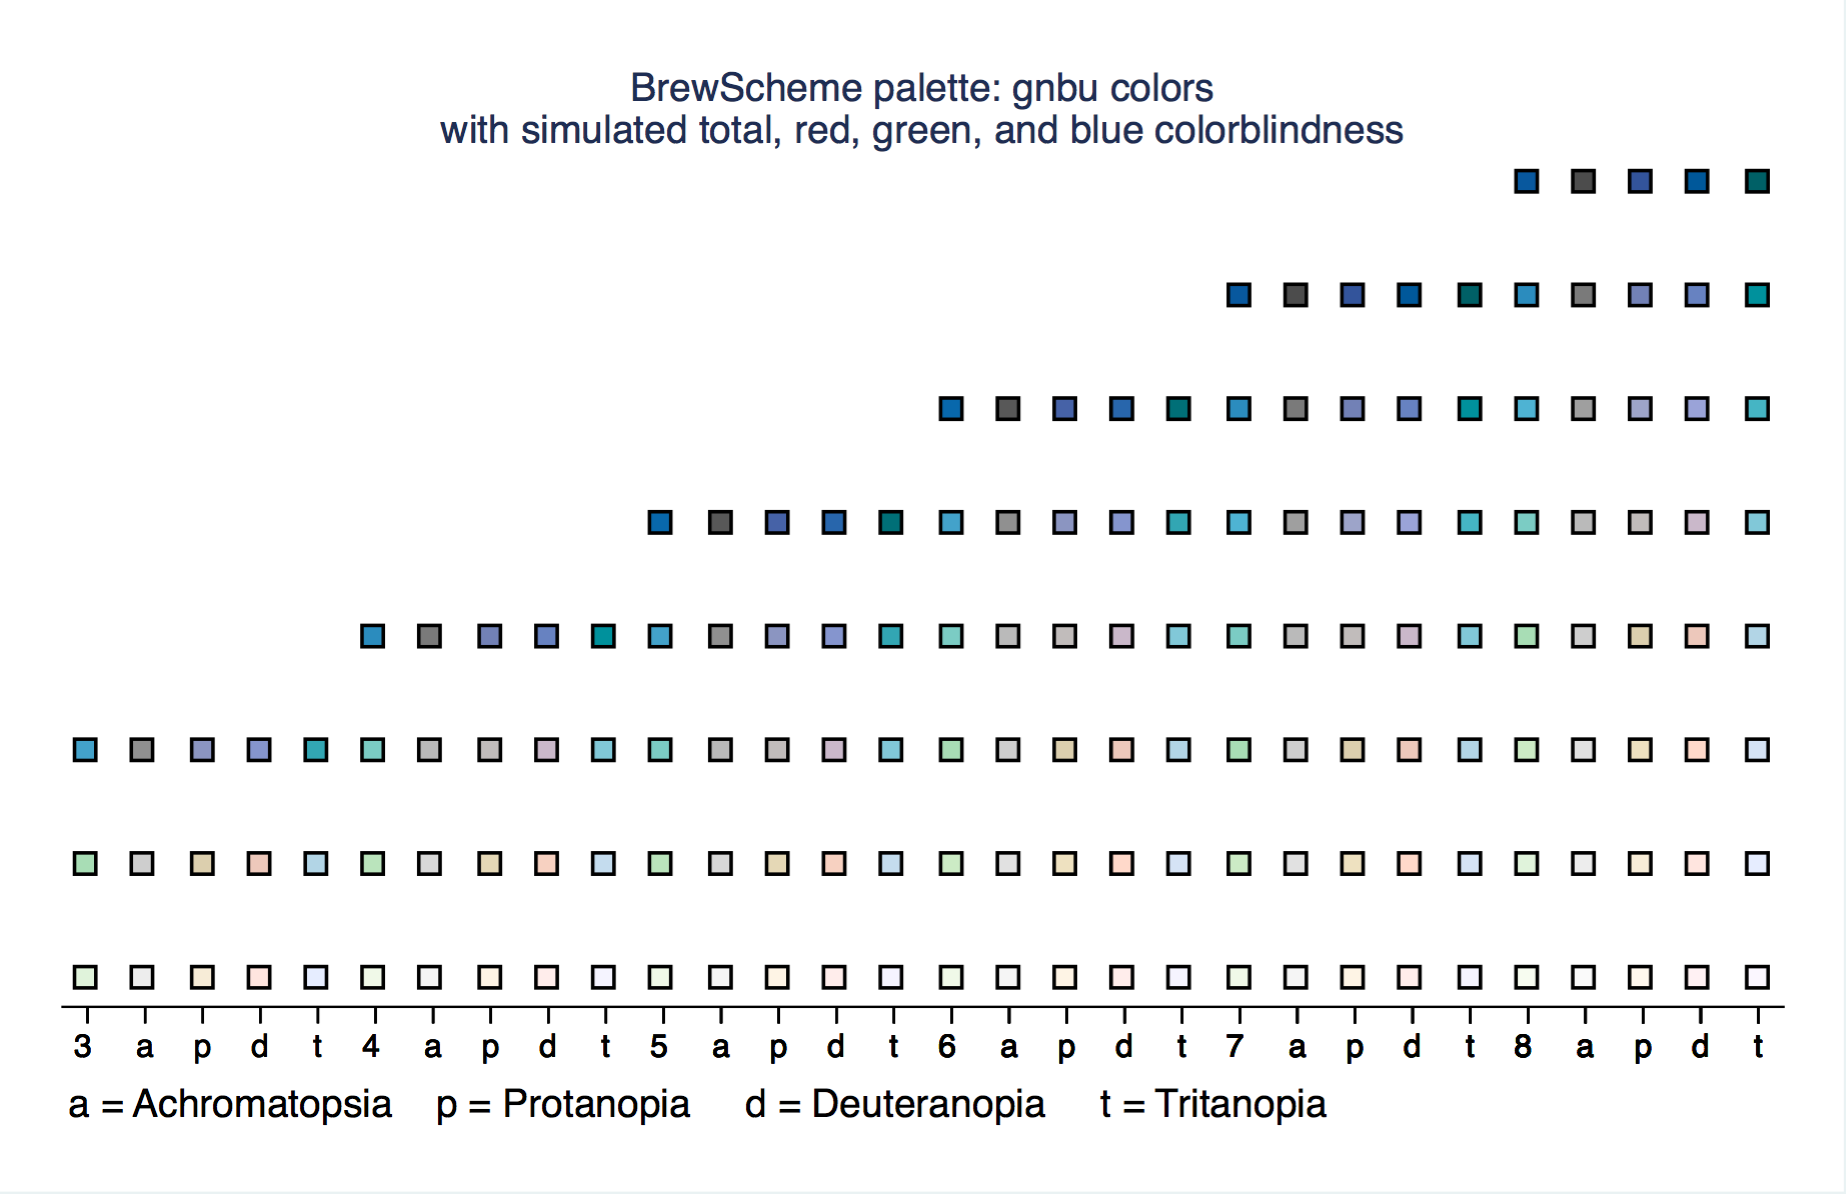 top of the gallery back to the top
greens
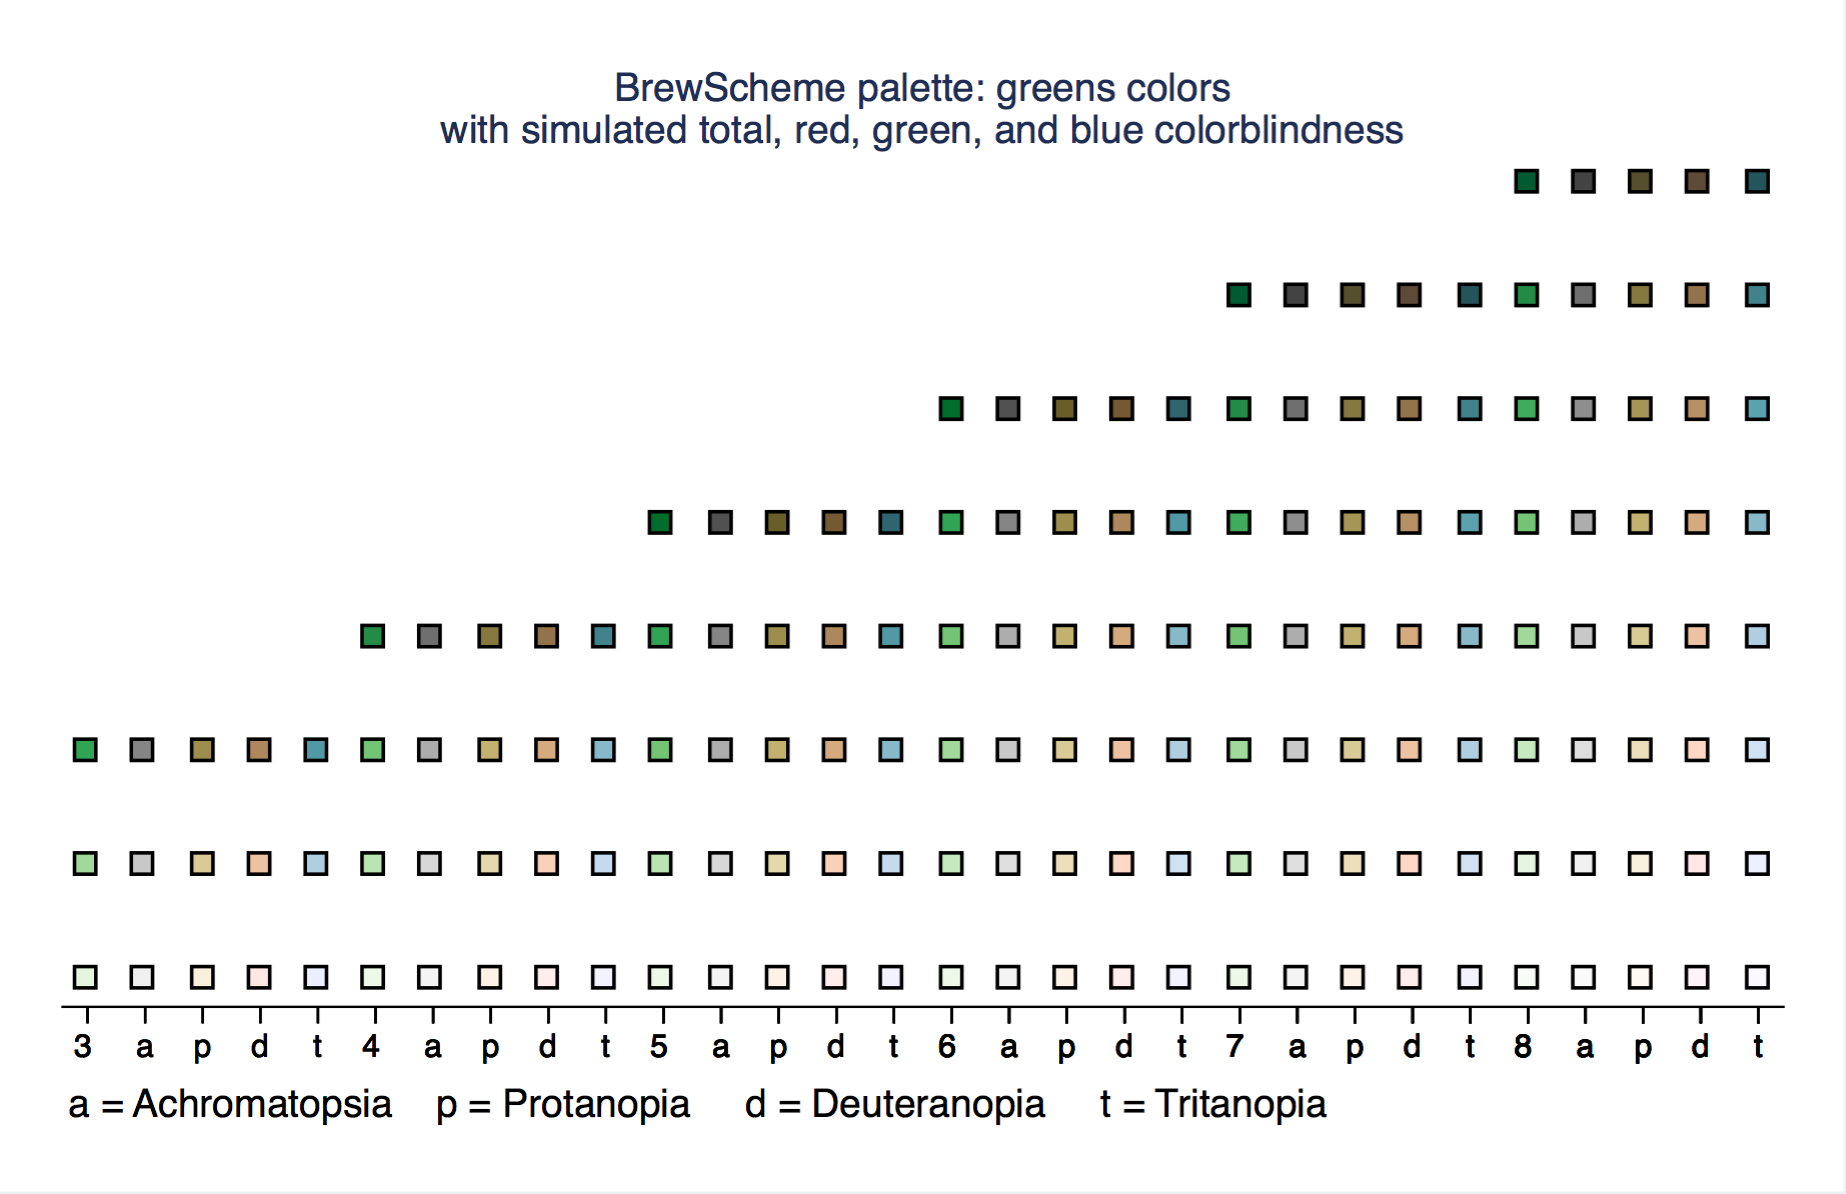 top of the gallery back to the top
greys
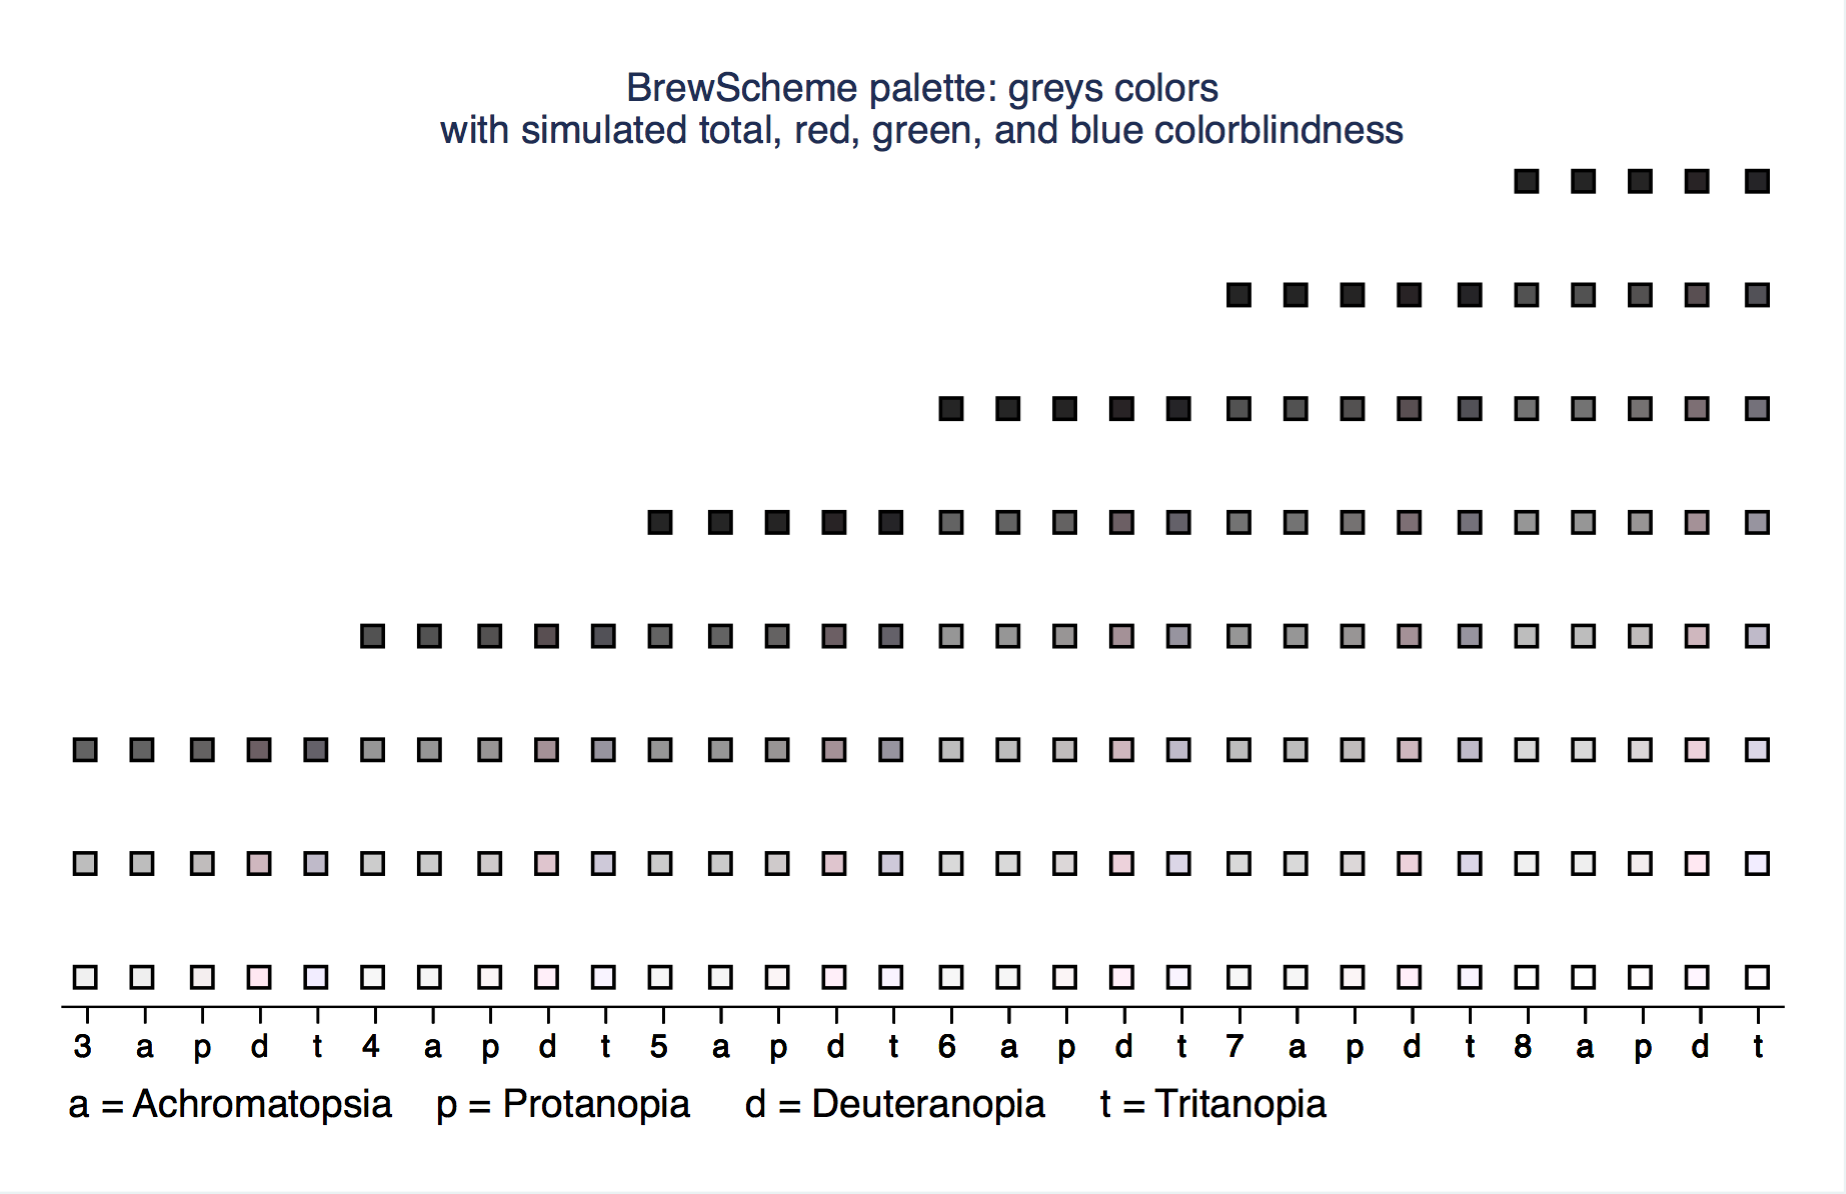 top of the gallery back to the top
mdebar
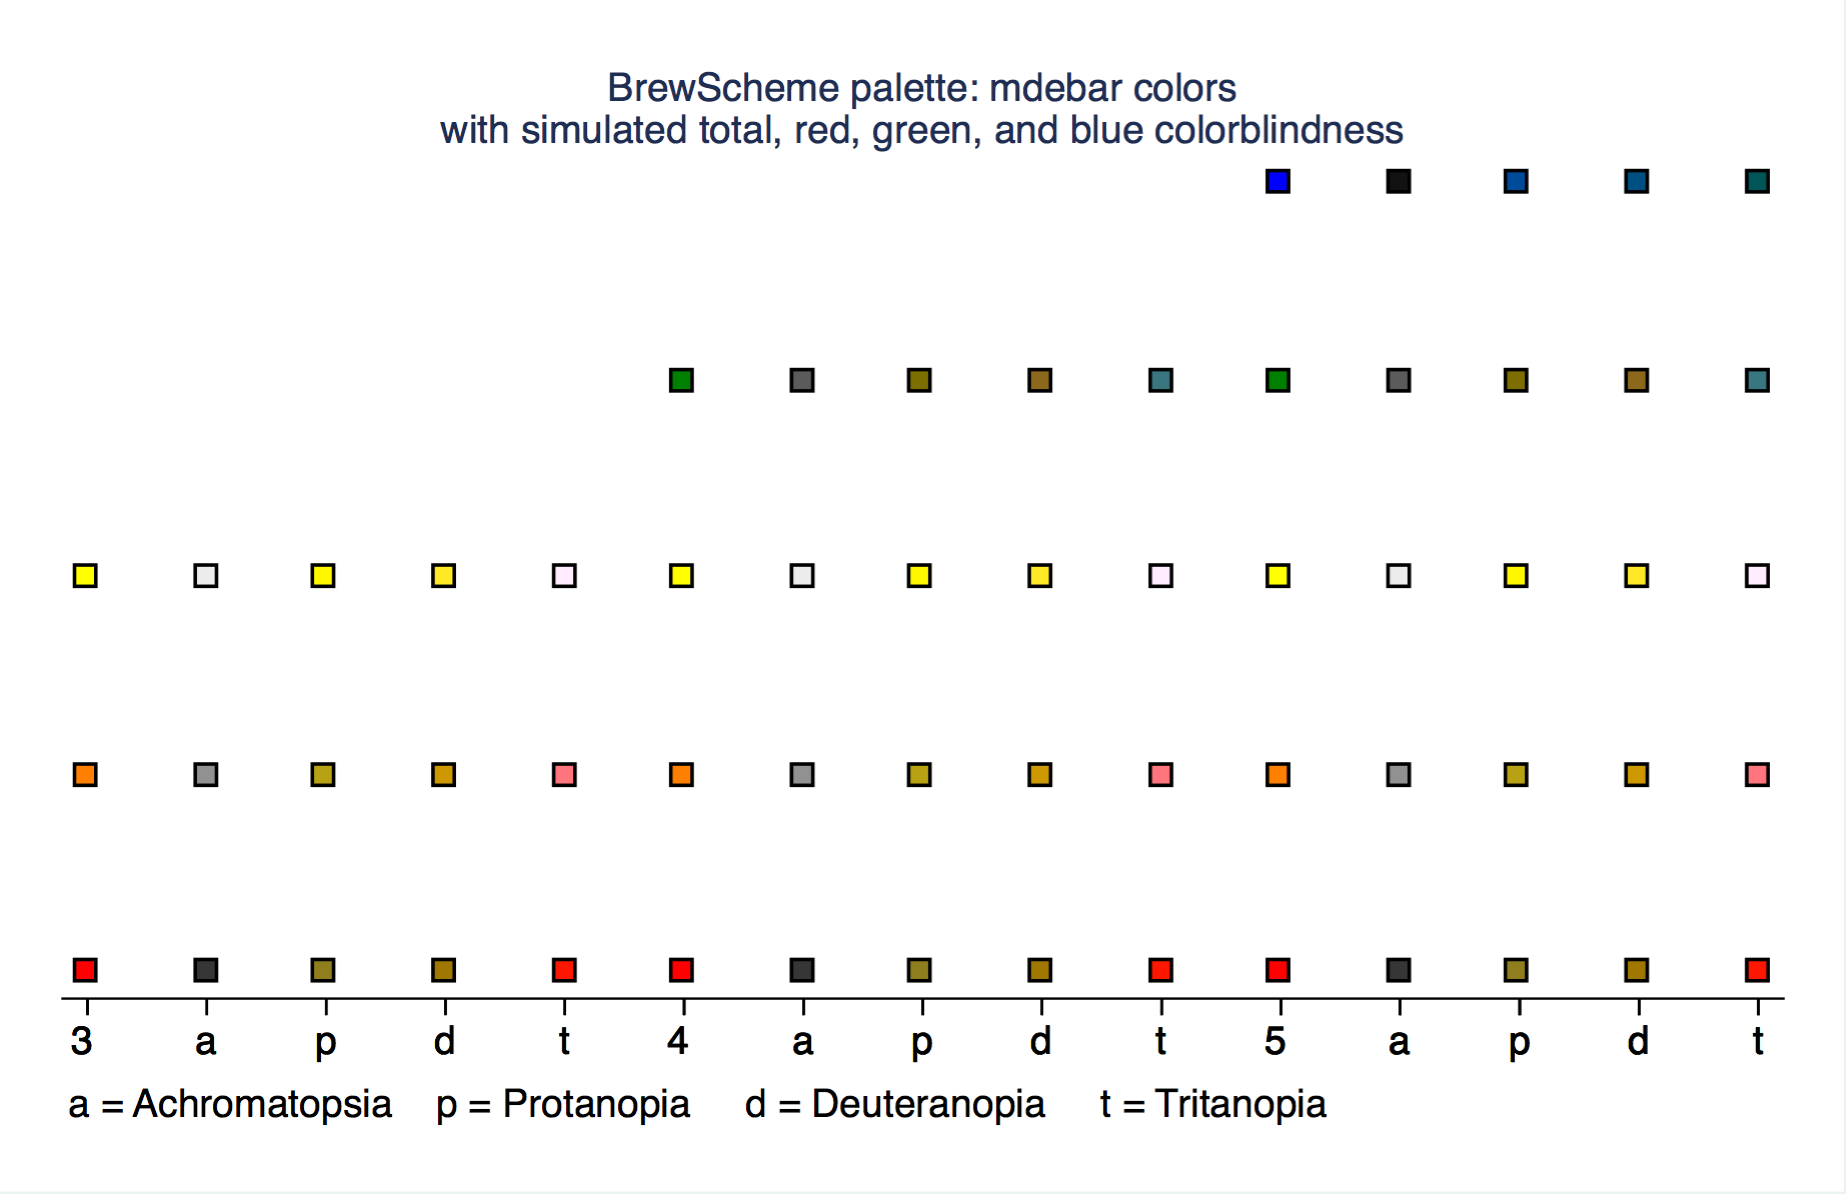 top of the gallery back to the top
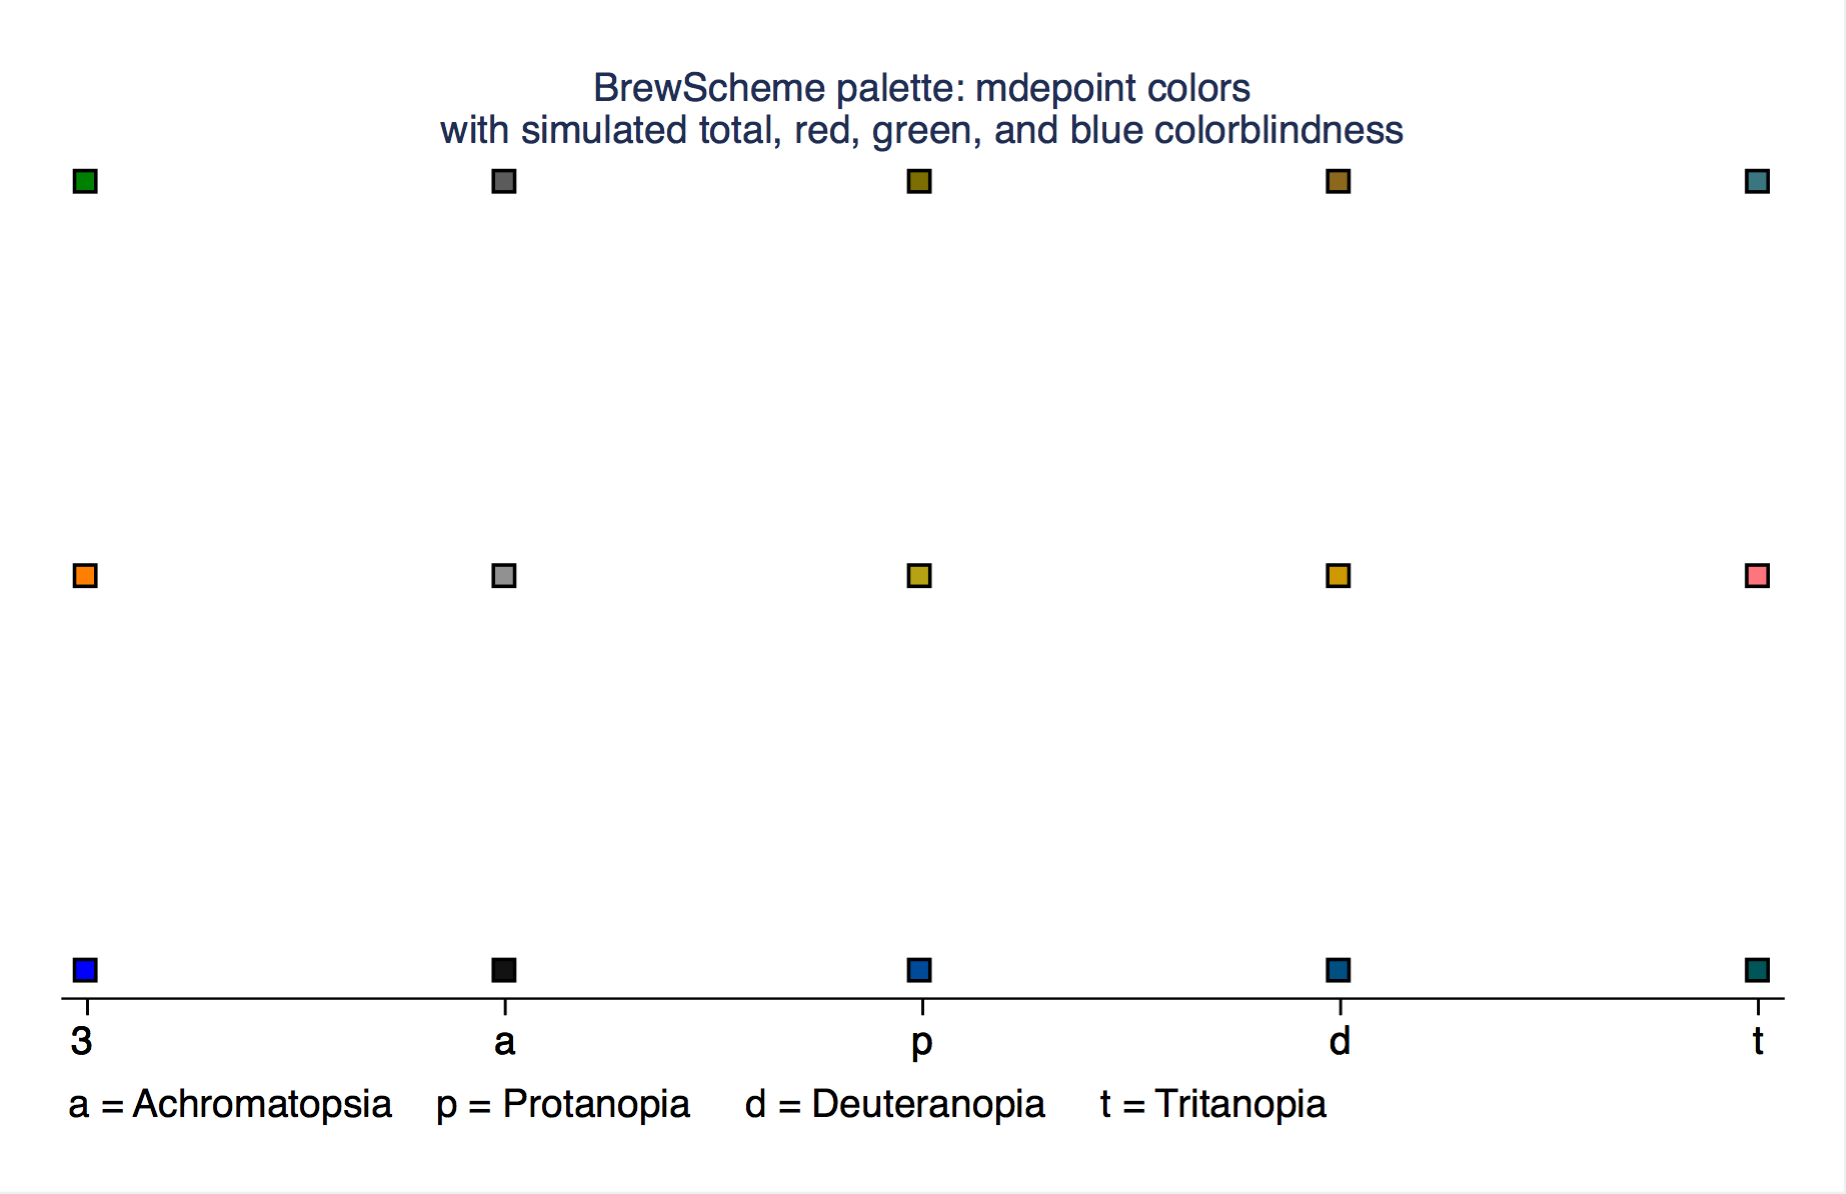
mdepoint
 top of the gallery back to the top
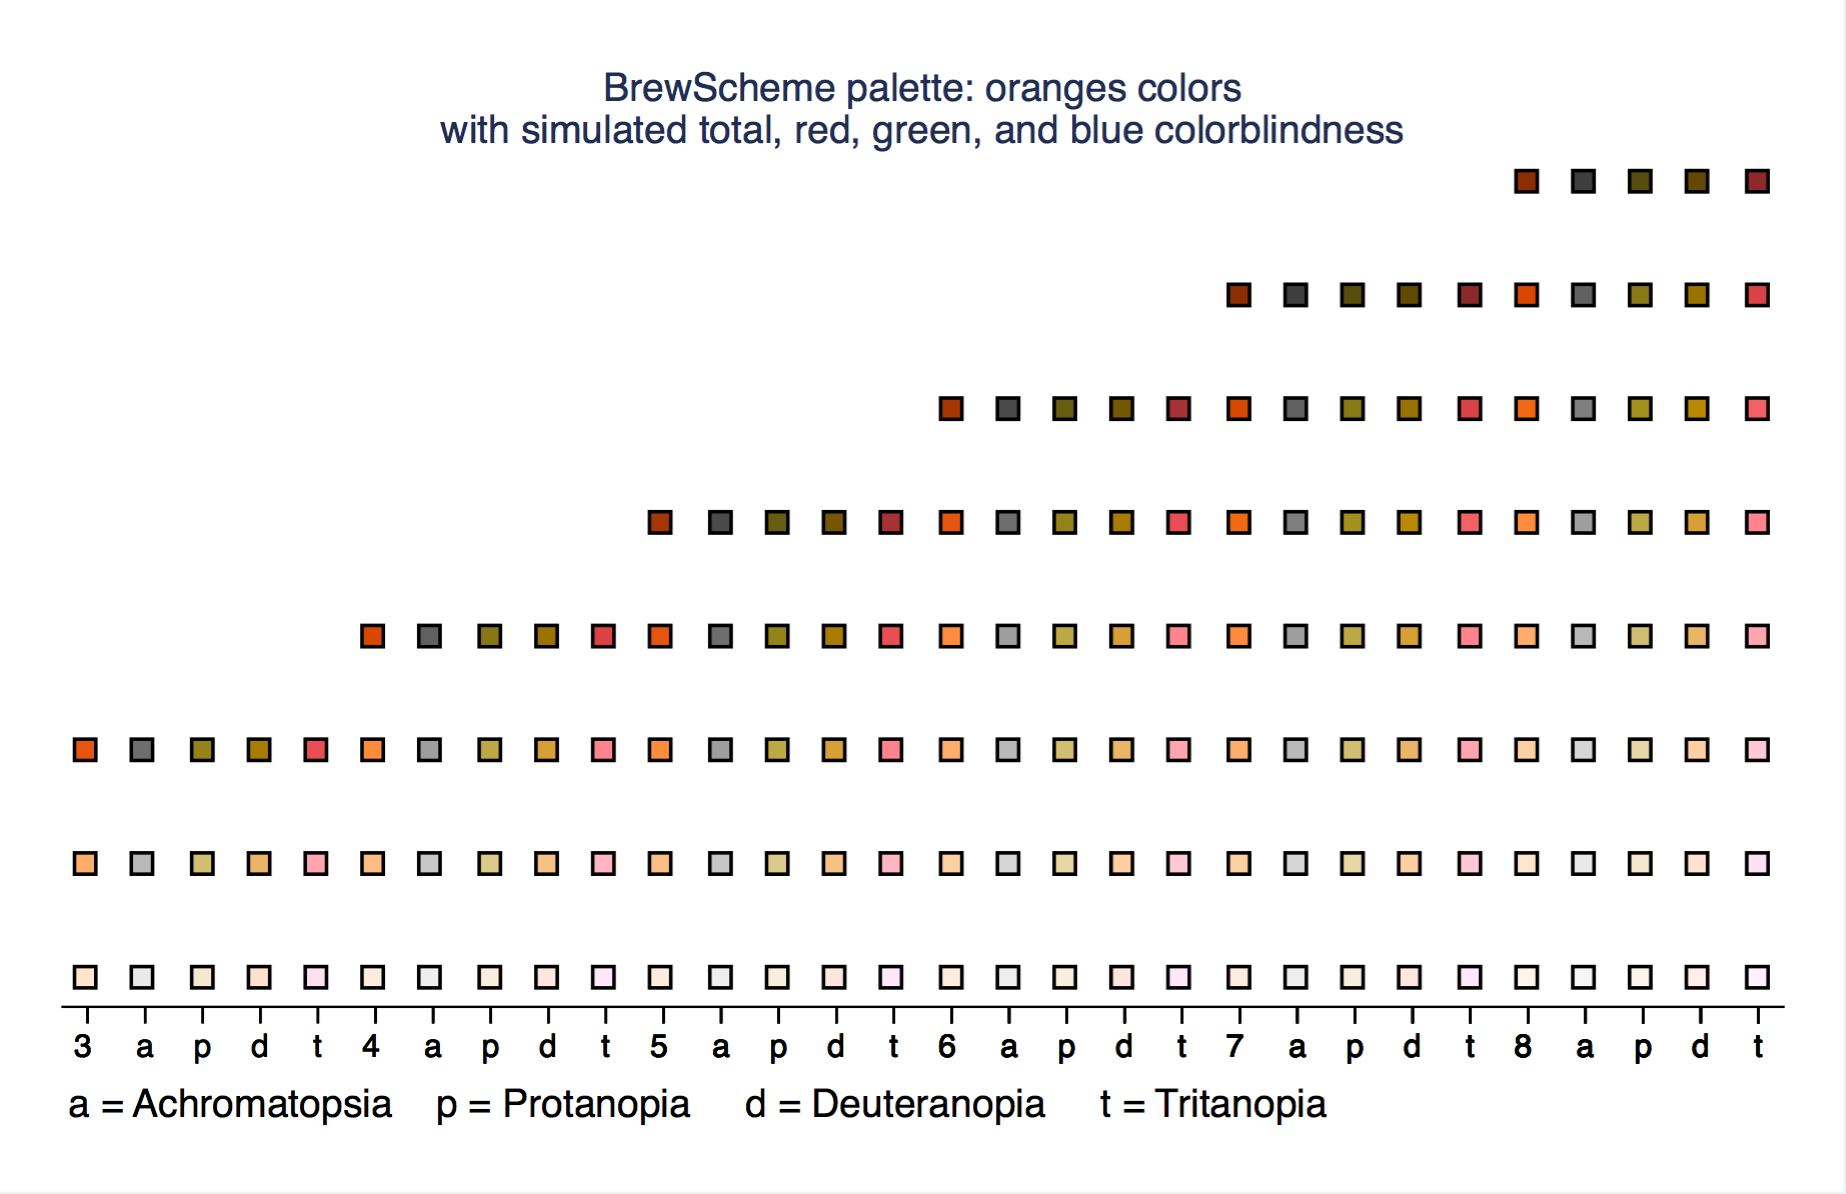
oranges
 top of the gallery back to the top
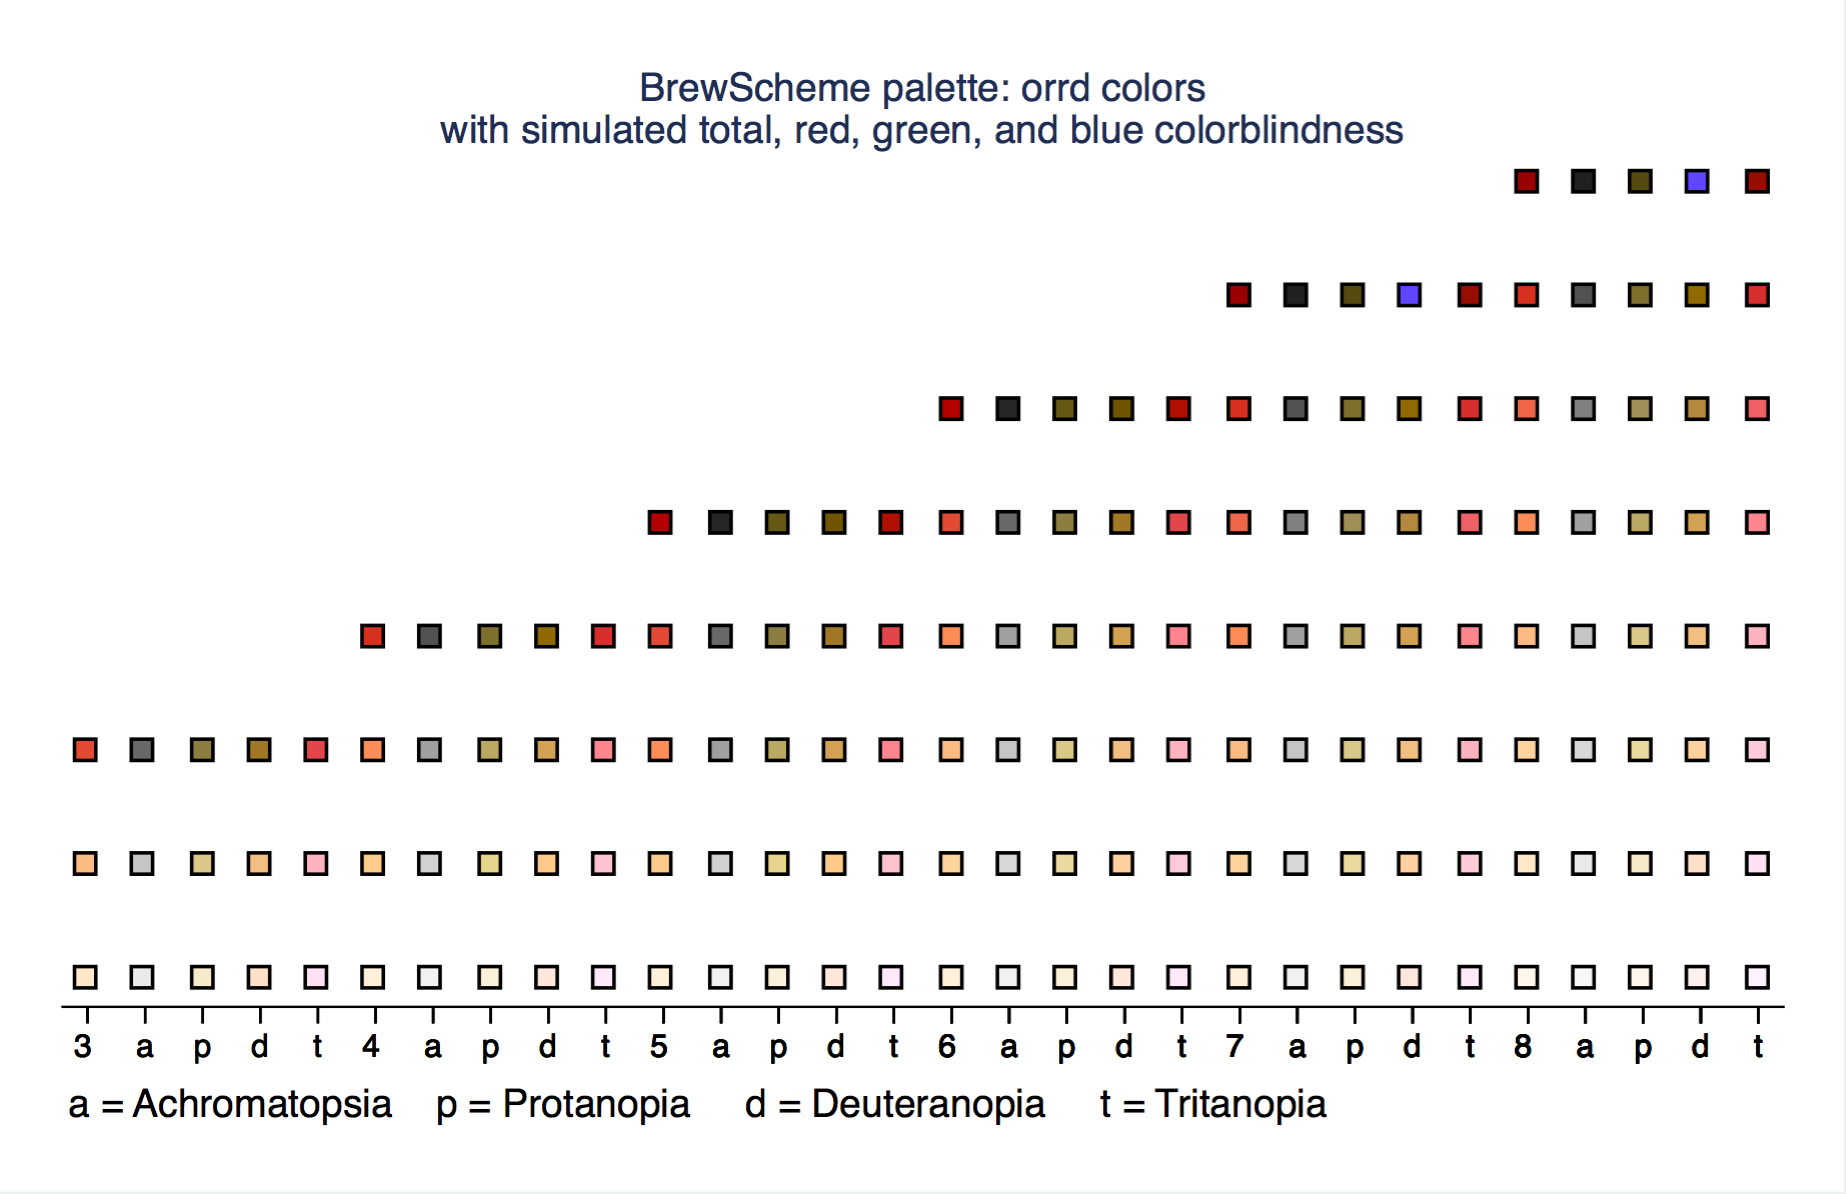
orrd
 top of the gallery back to the top
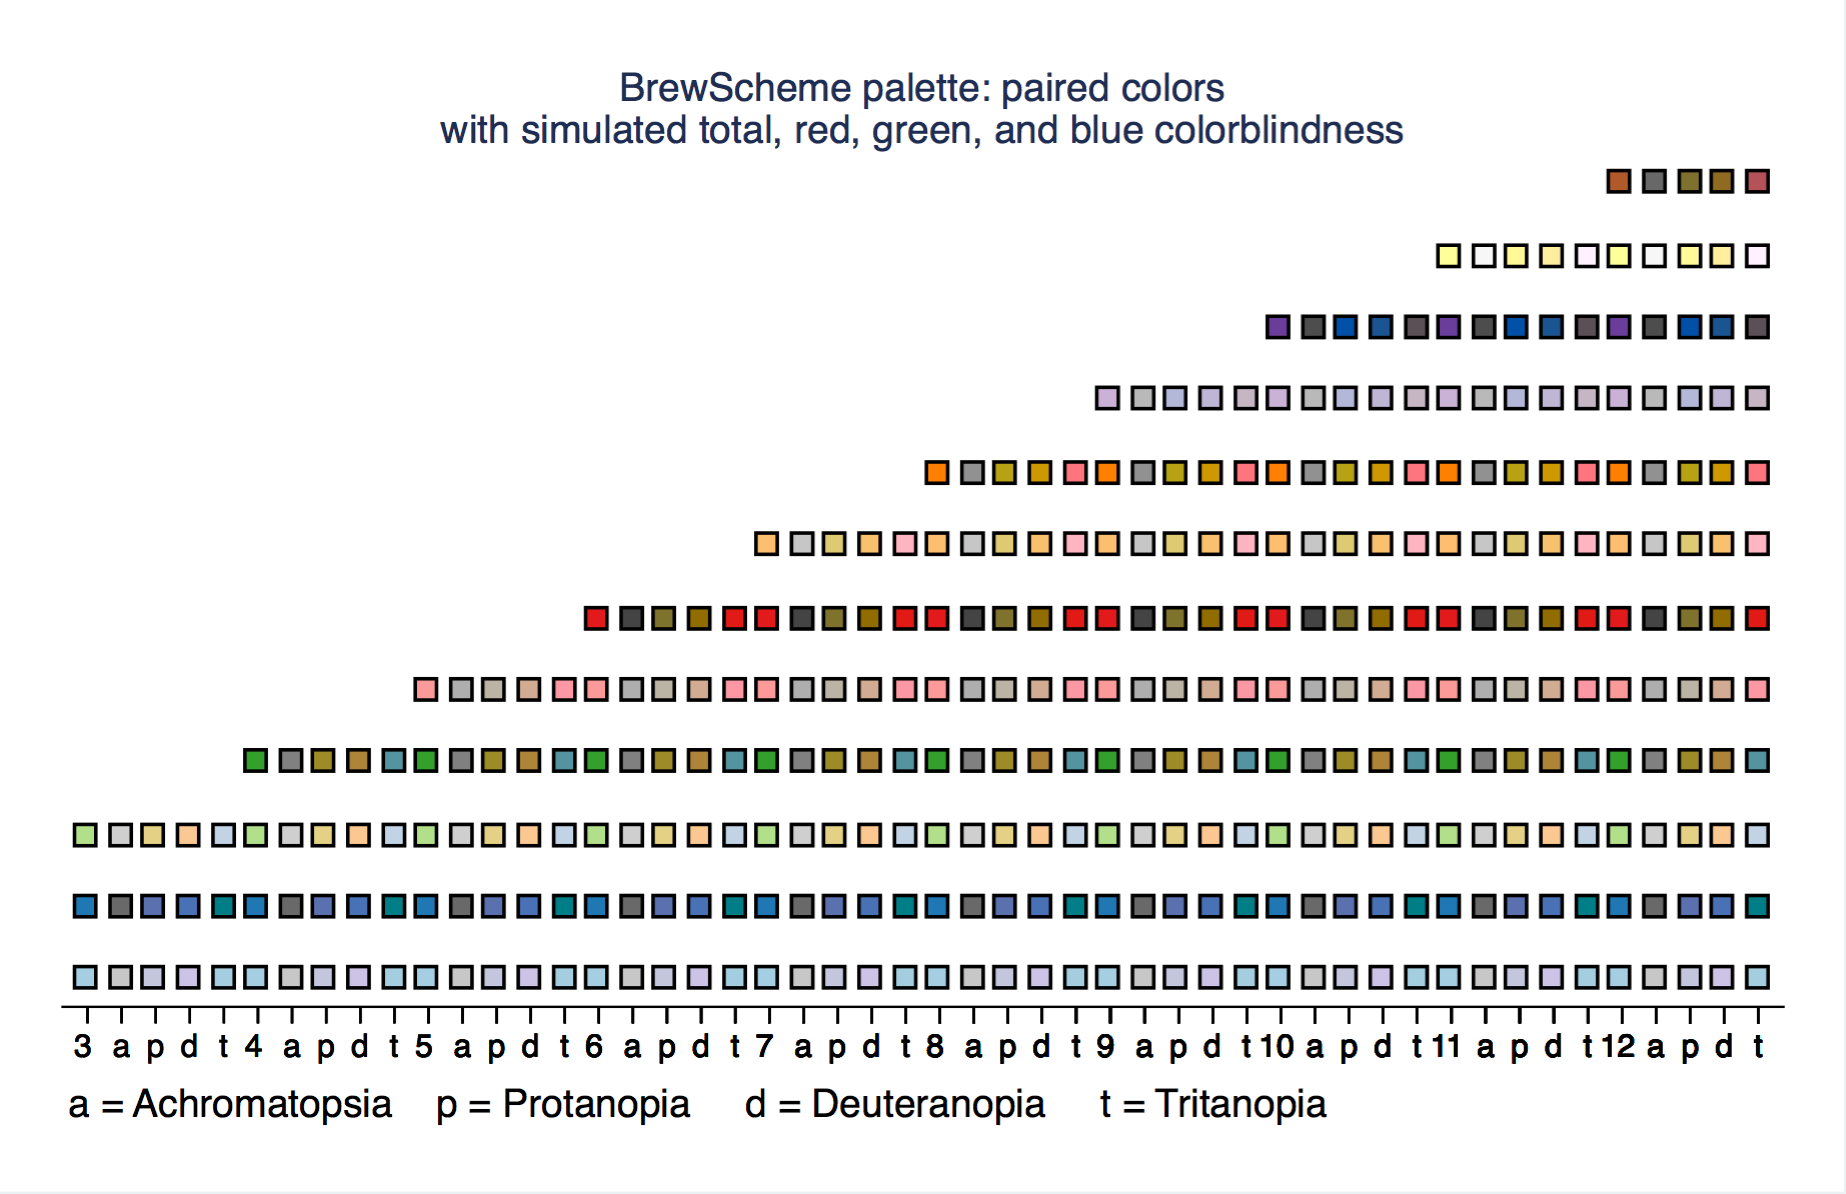
paired
 top of the gallery back to the top
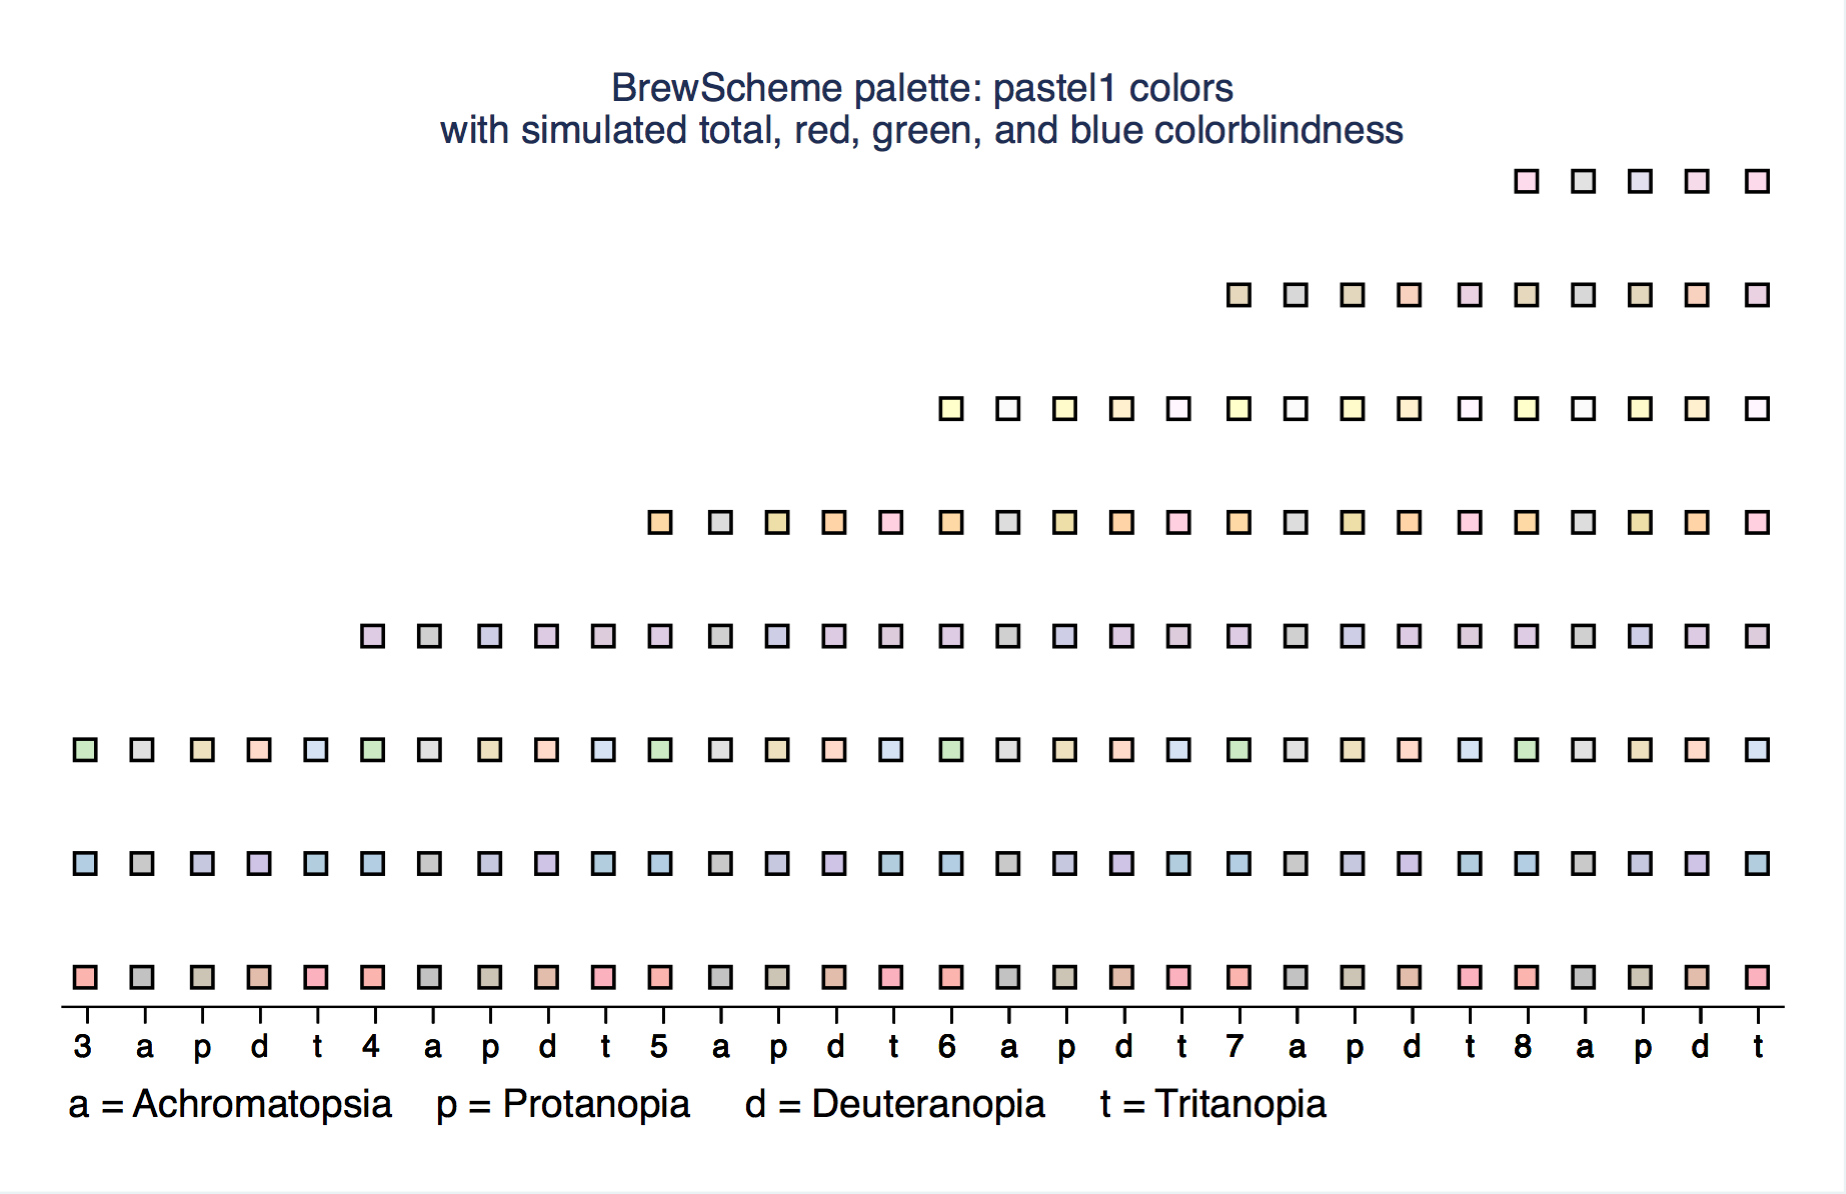
pastel1
 top of the gallery back to the top
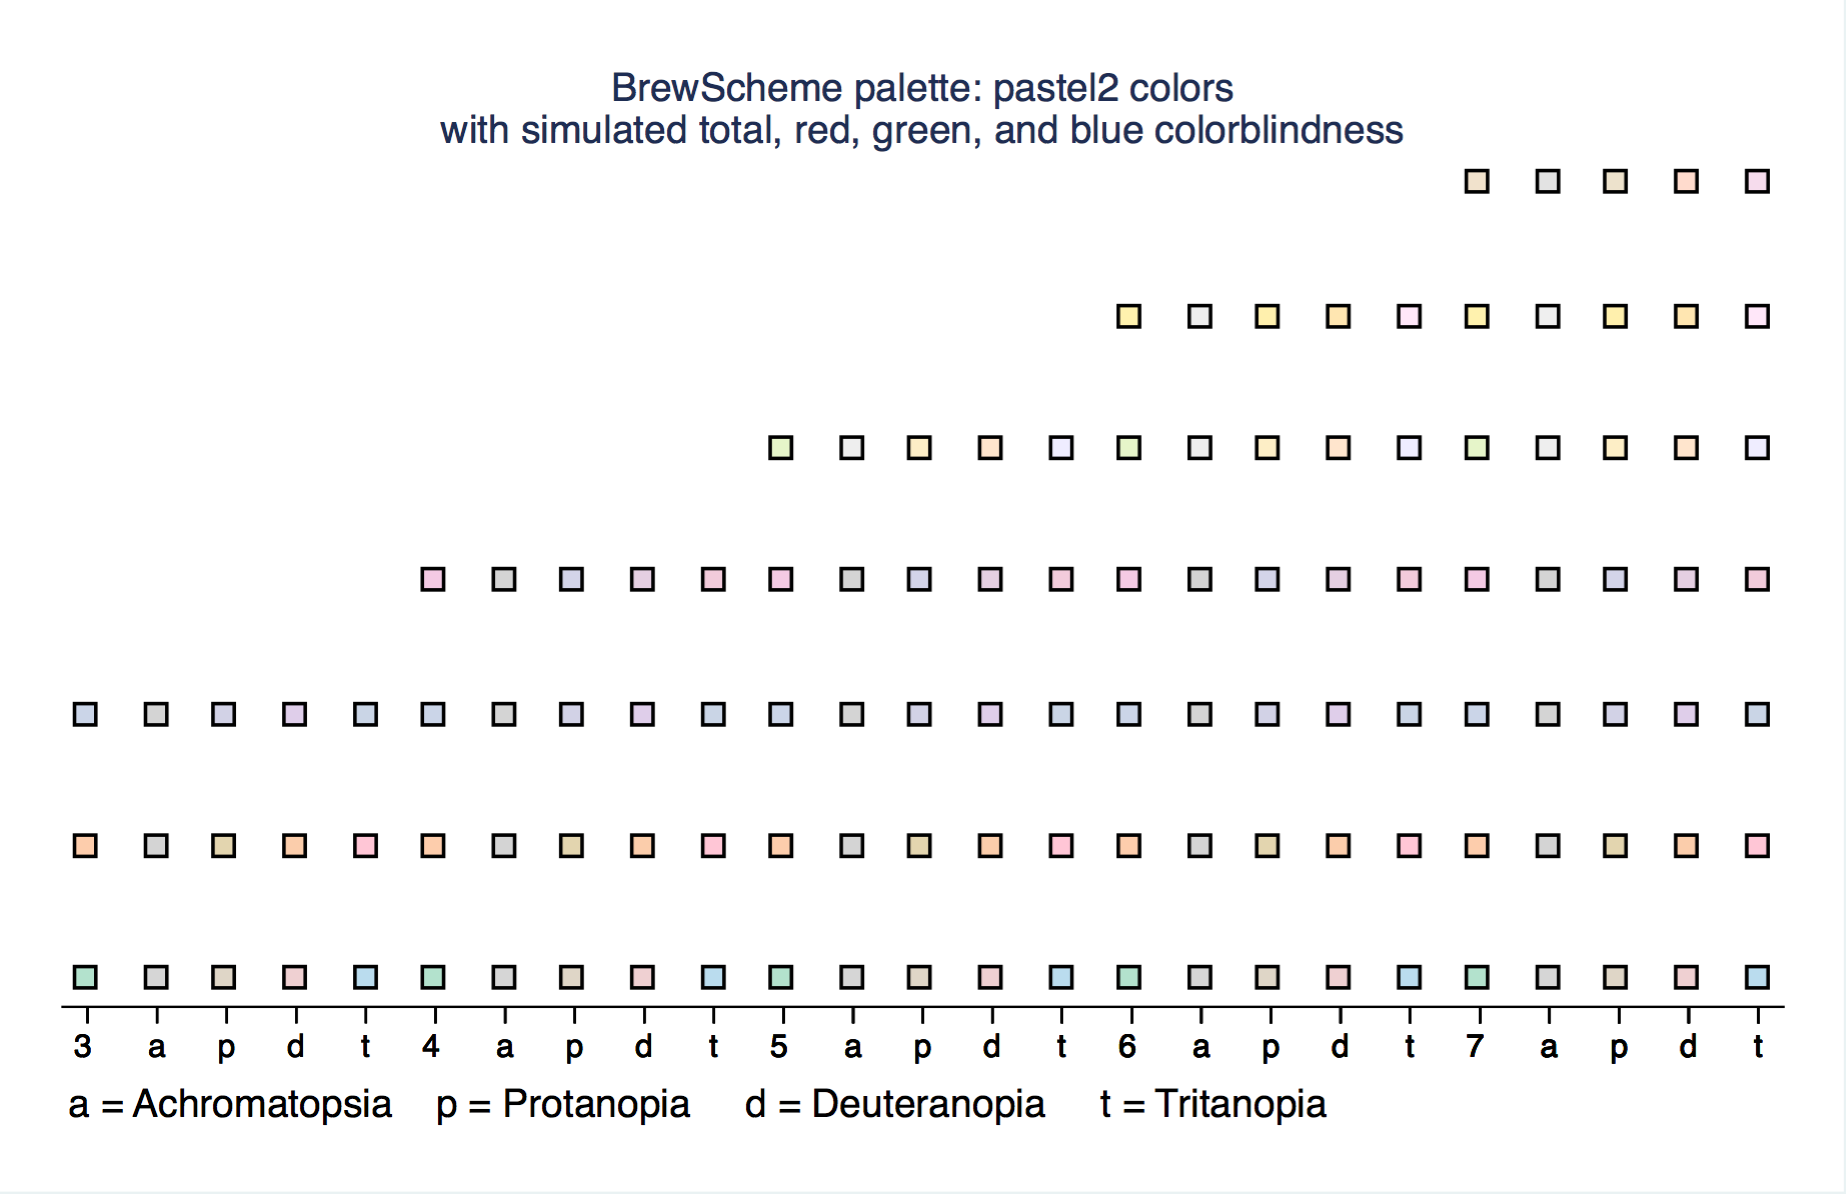
pastel2
 top of the gallery back to the top
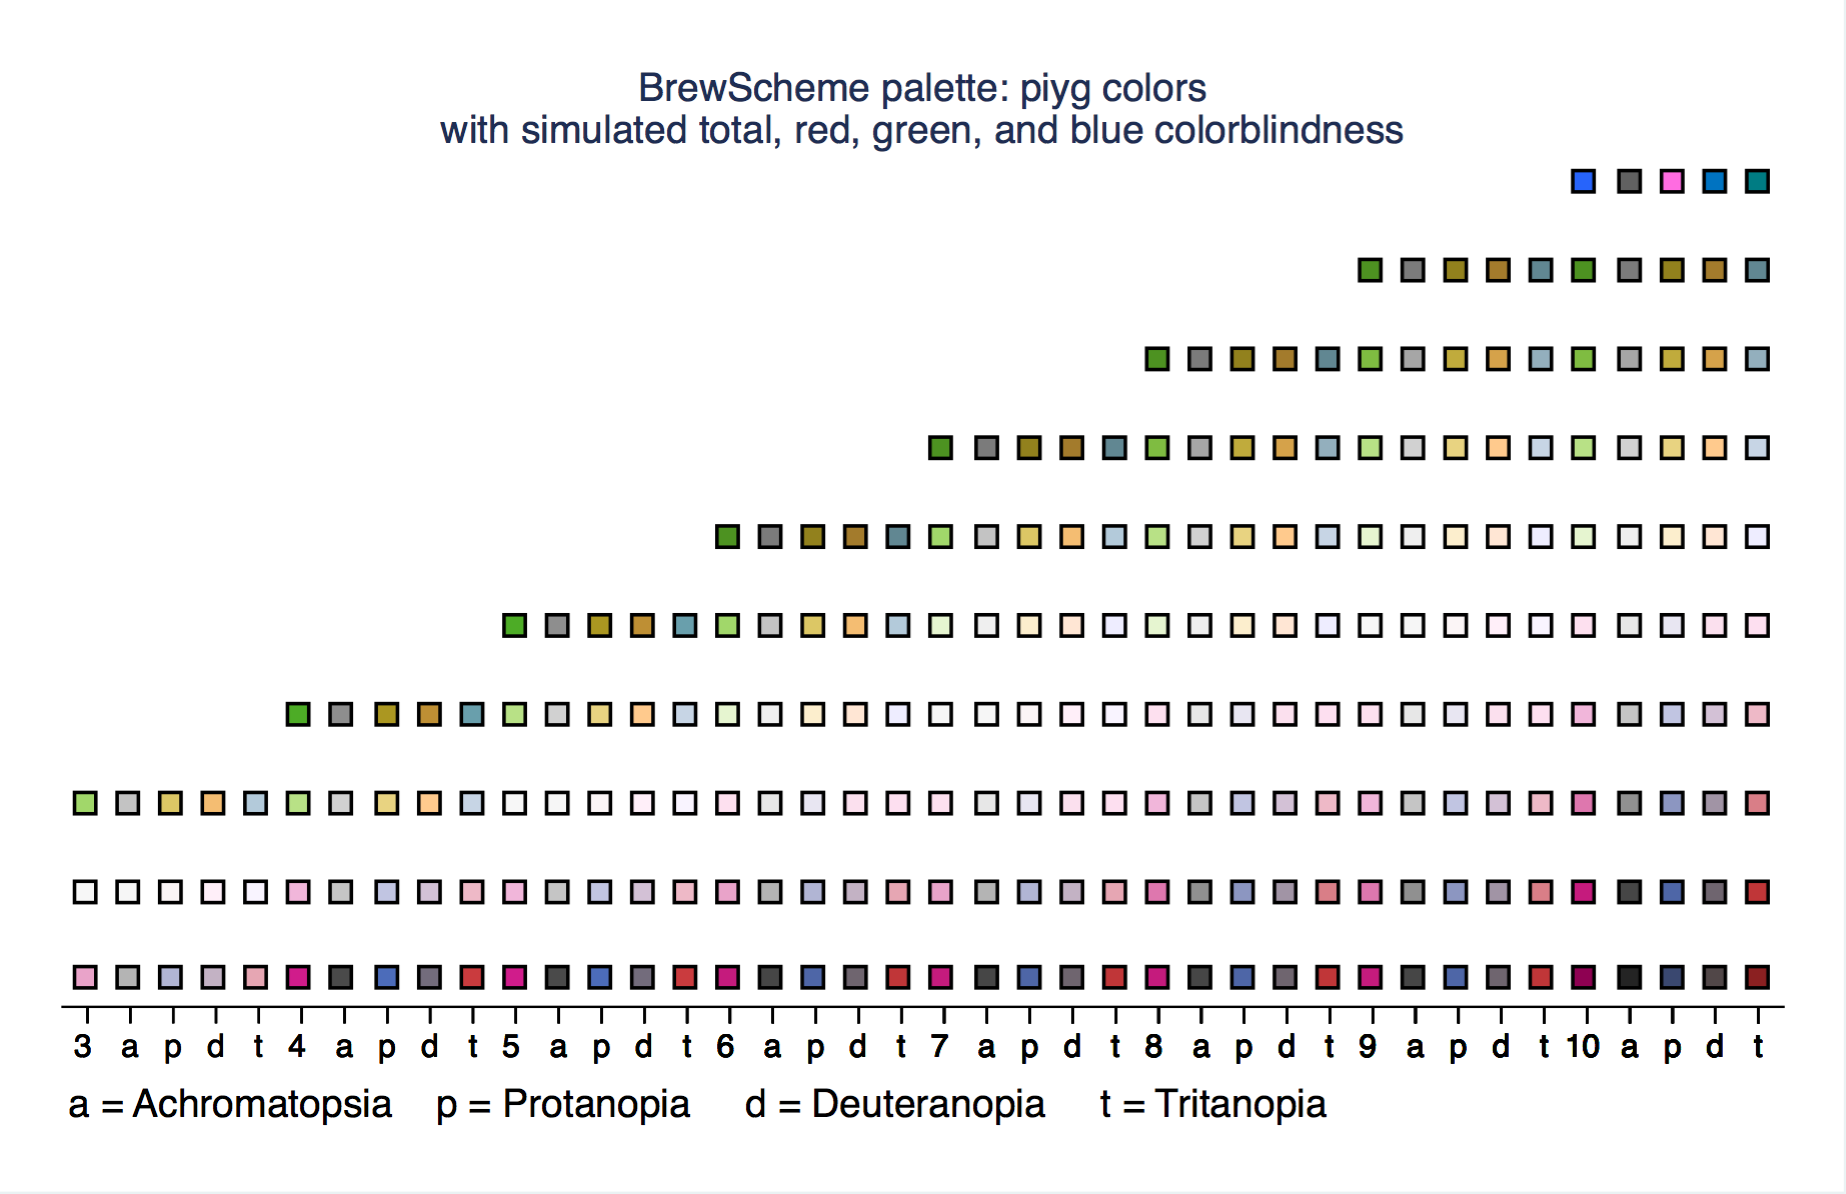
piyg
 top of the gallery back to the top
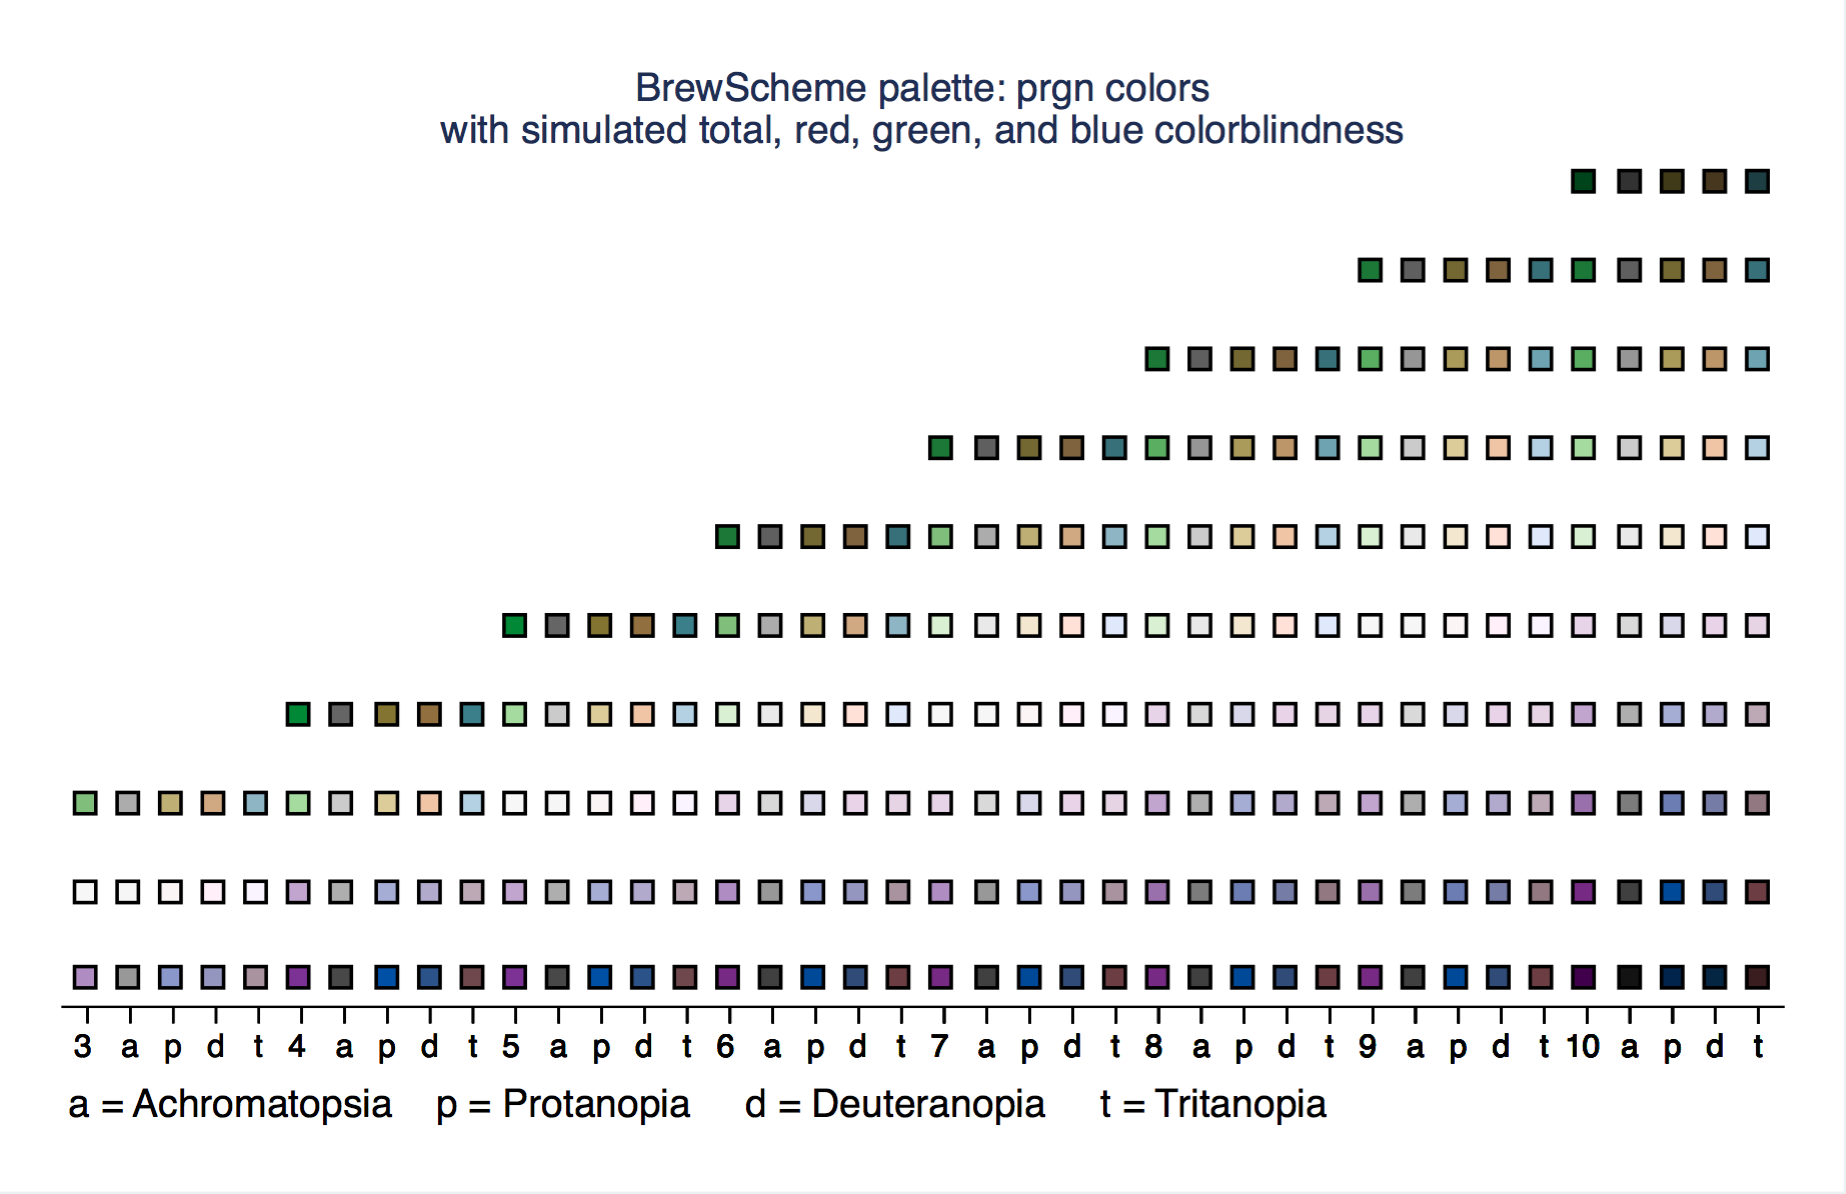
prgn
 top of the gallery back to the top
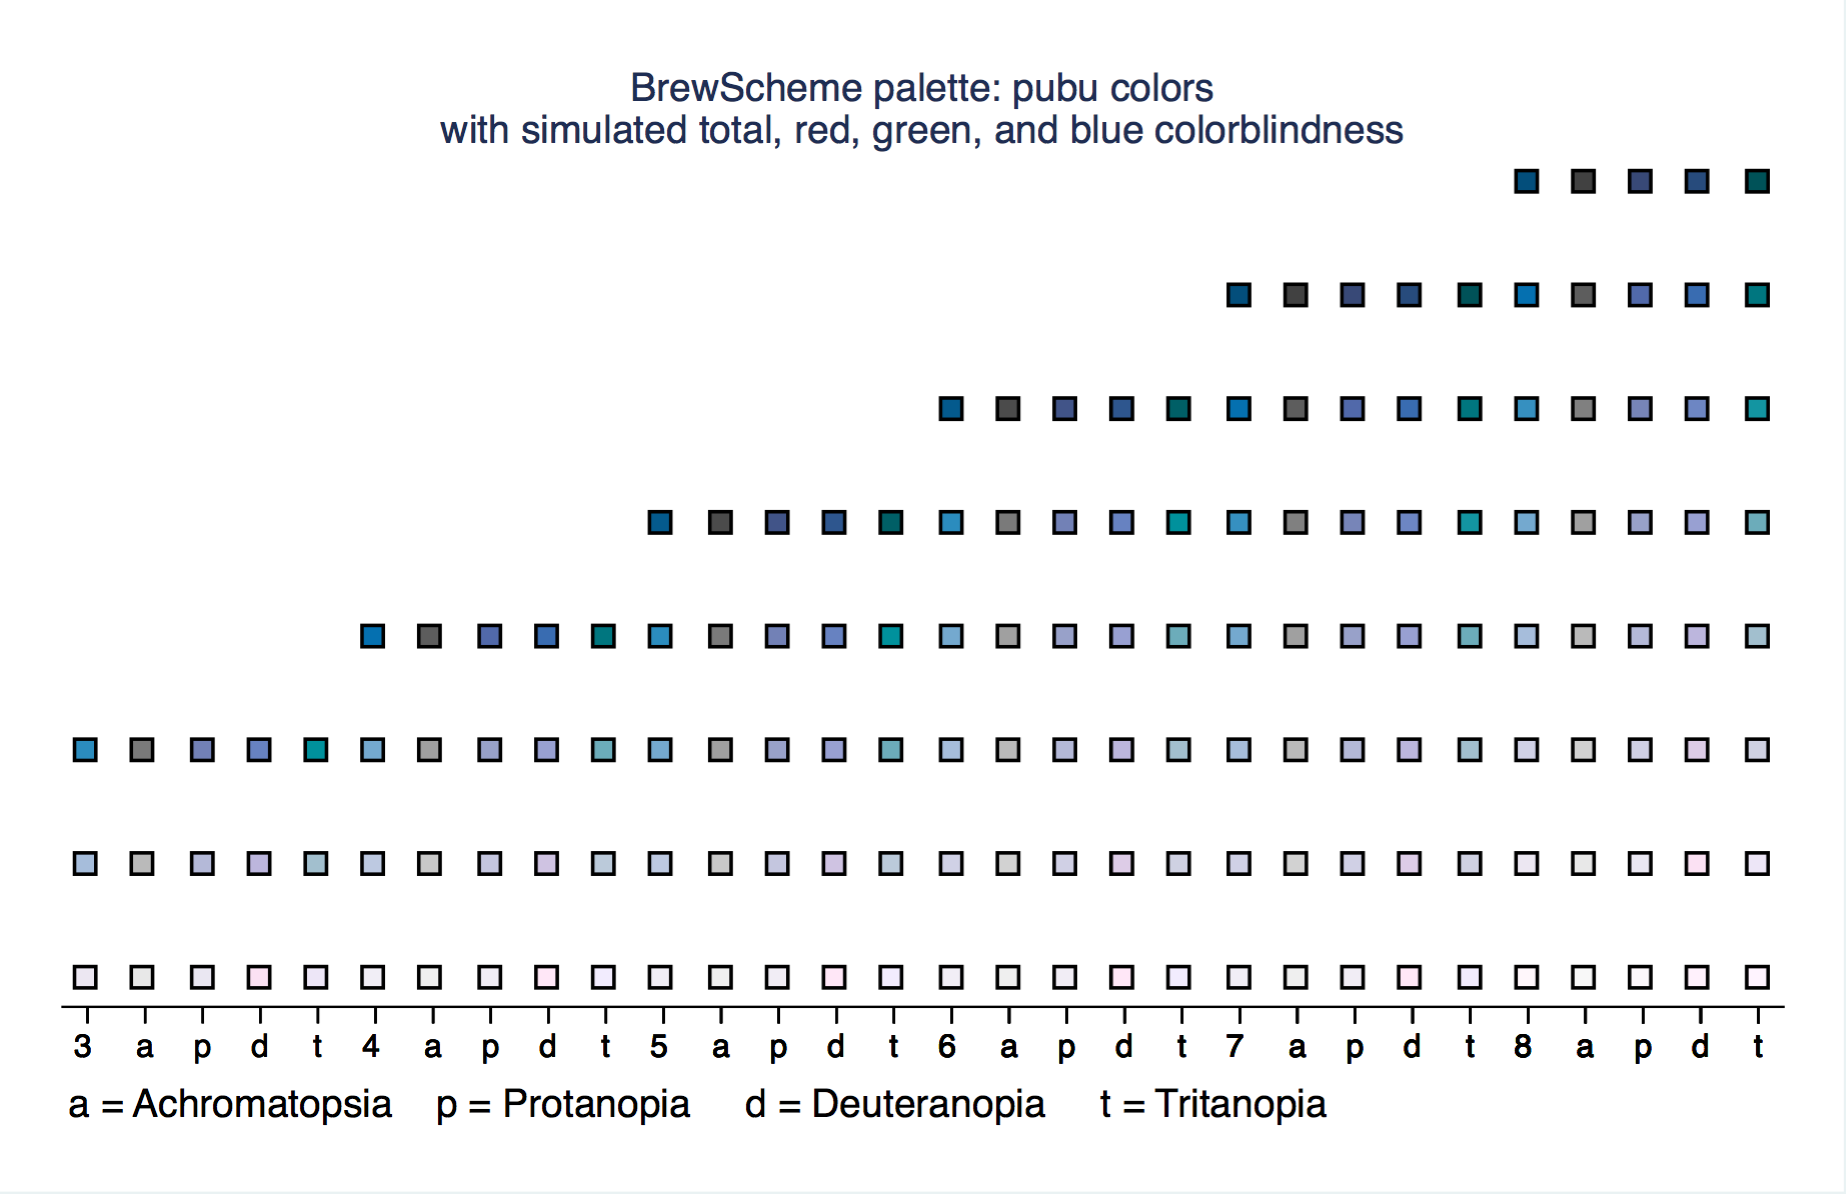
pubu
 top of the gallery back to the top
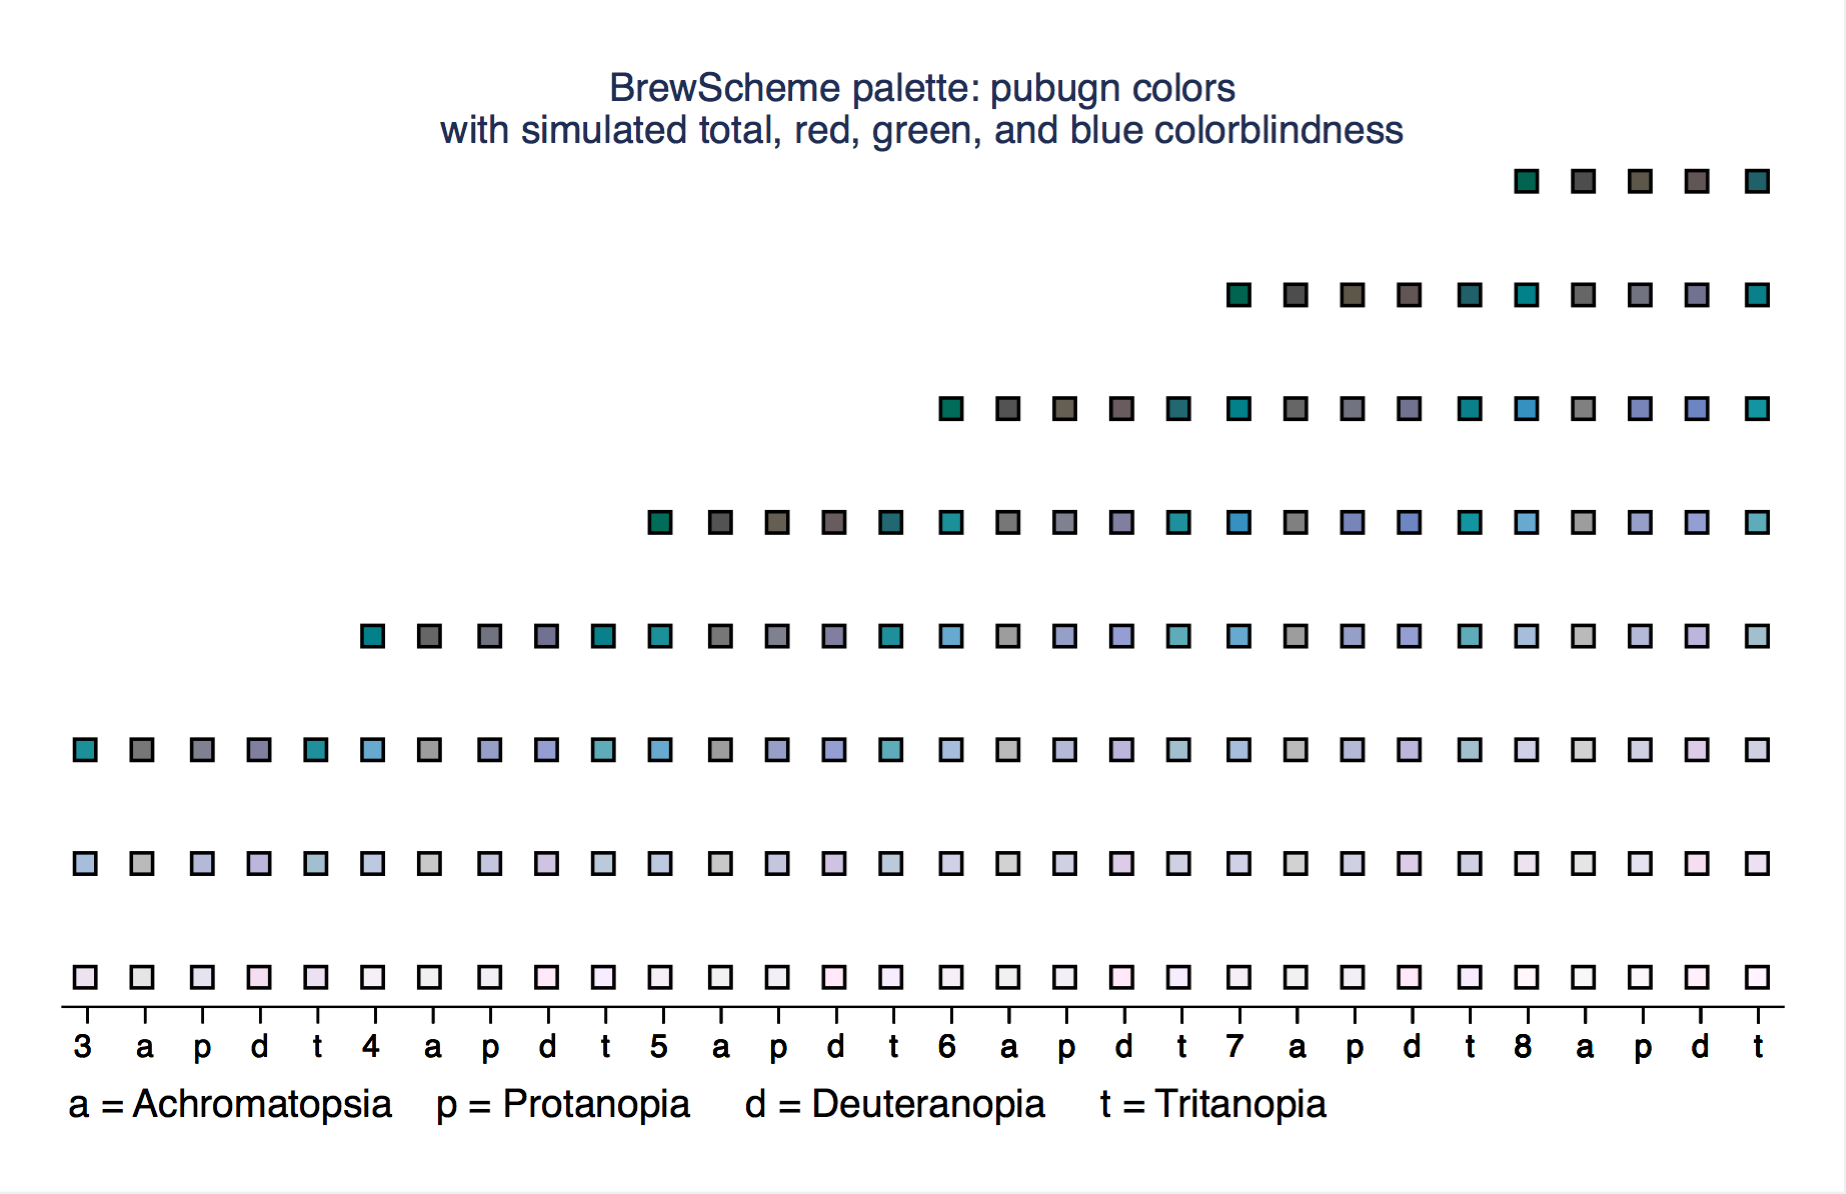
pubugn
 top of the gallery back to the top
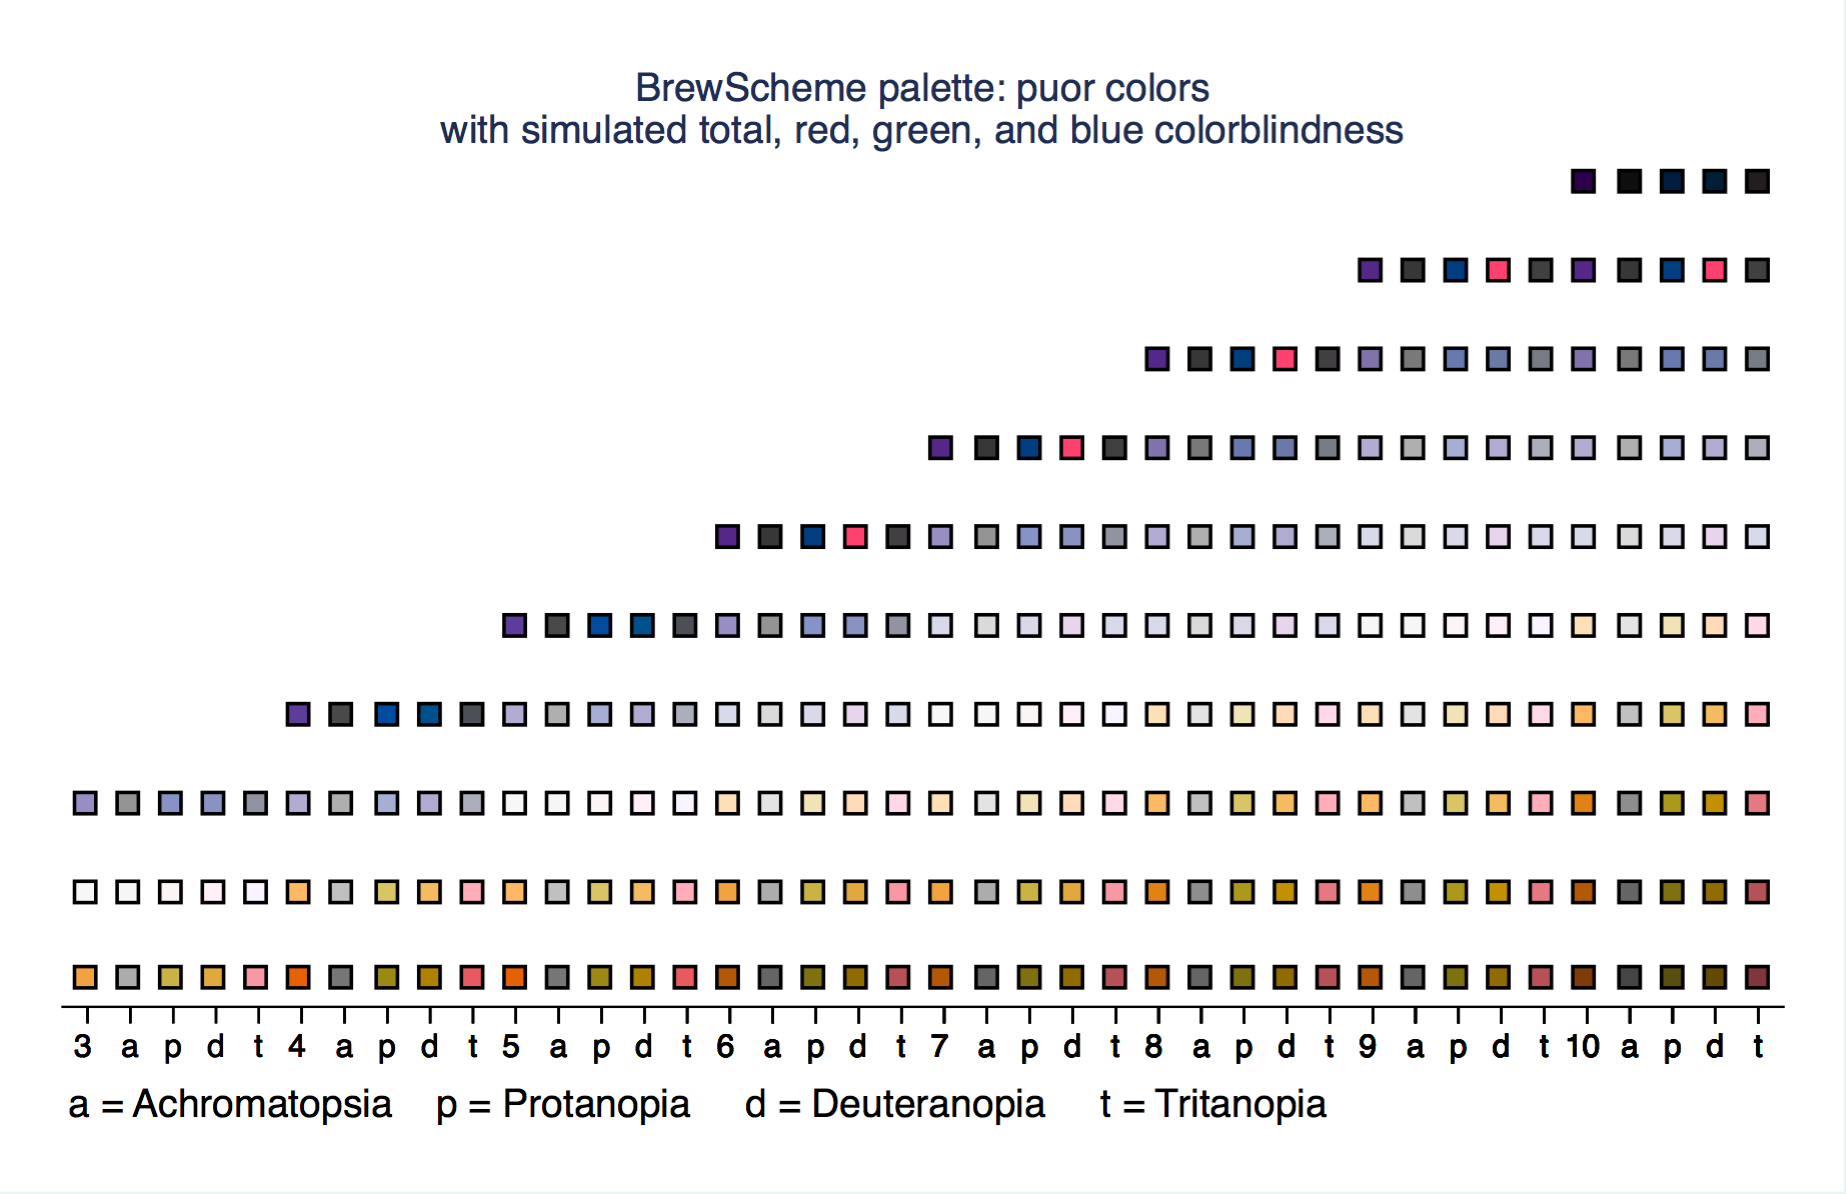
puor
 top of the gallery back to the top
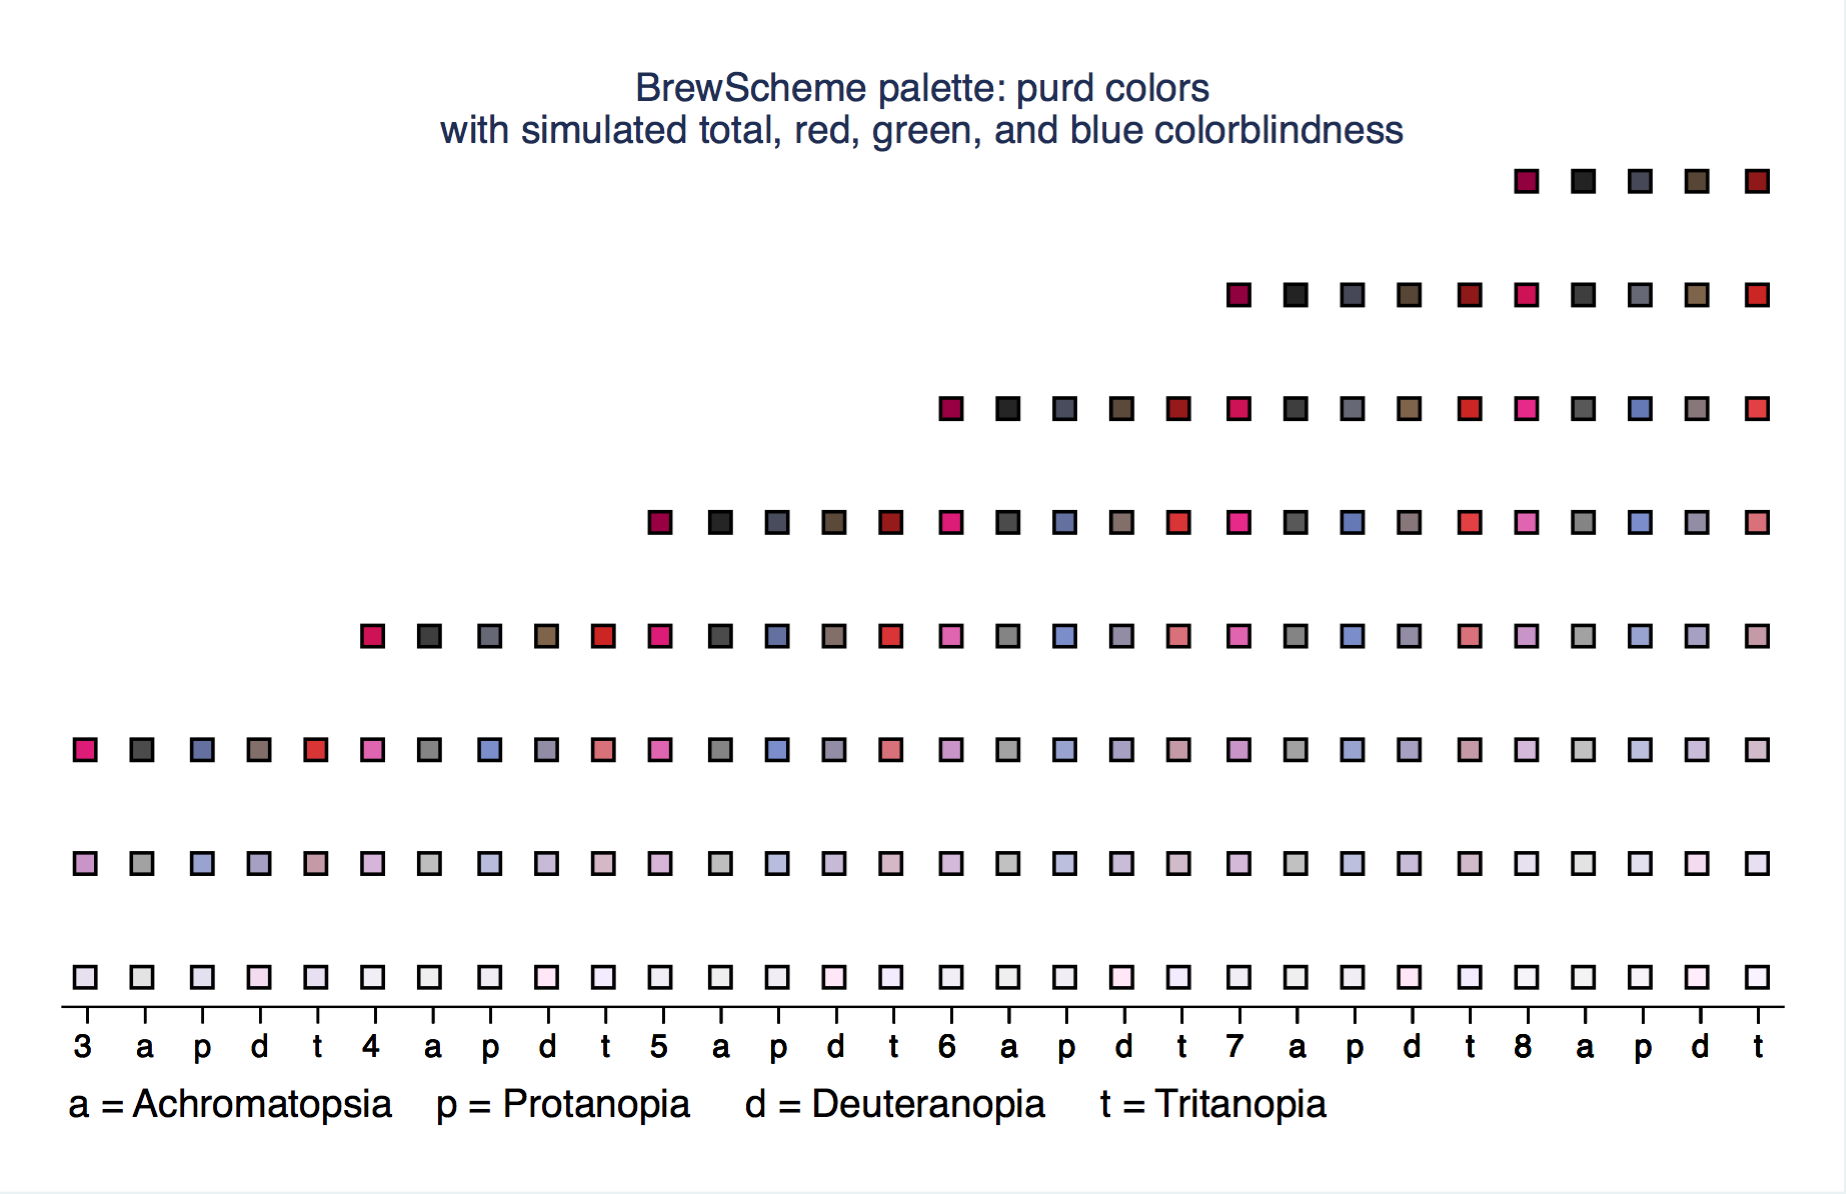
purd
 top of the gallery back to the top
purples
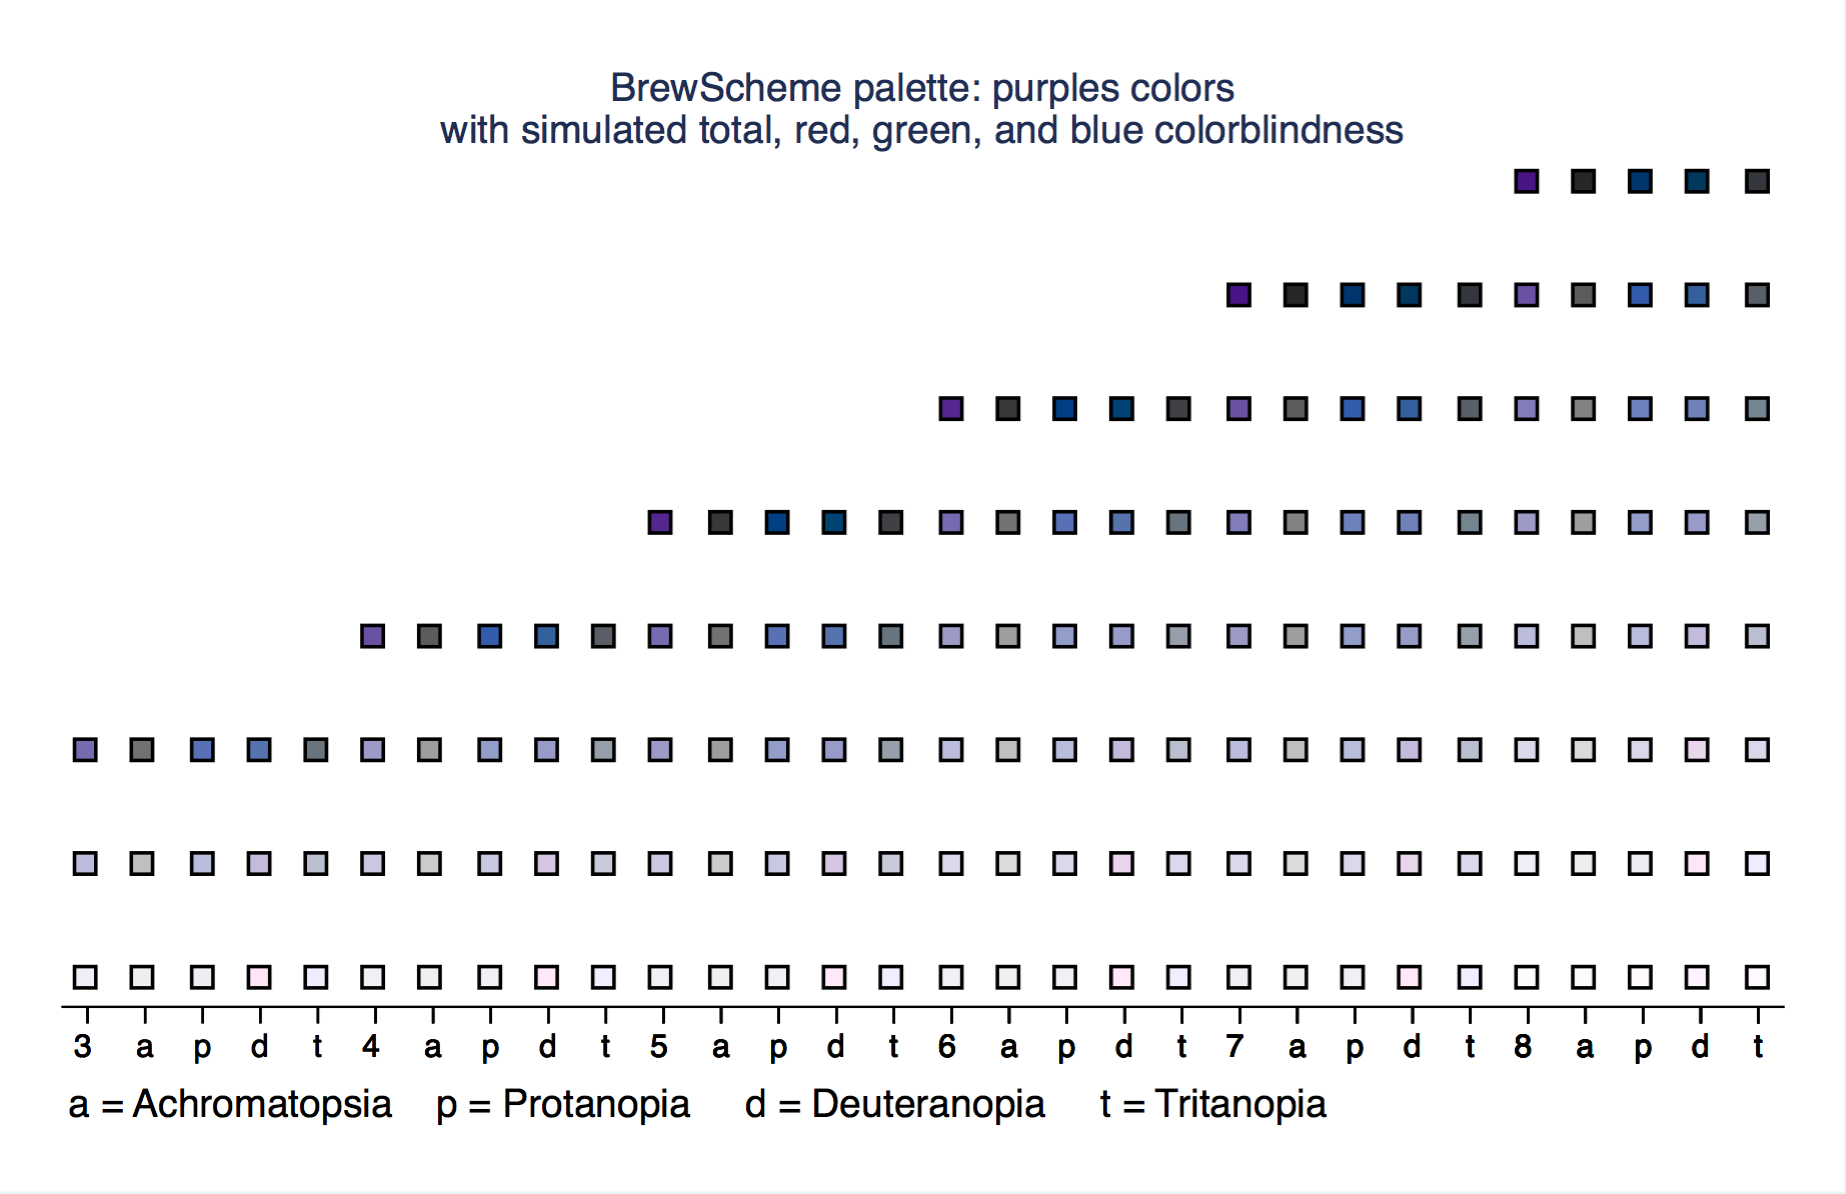 top of the gallery back to the top
rdbu
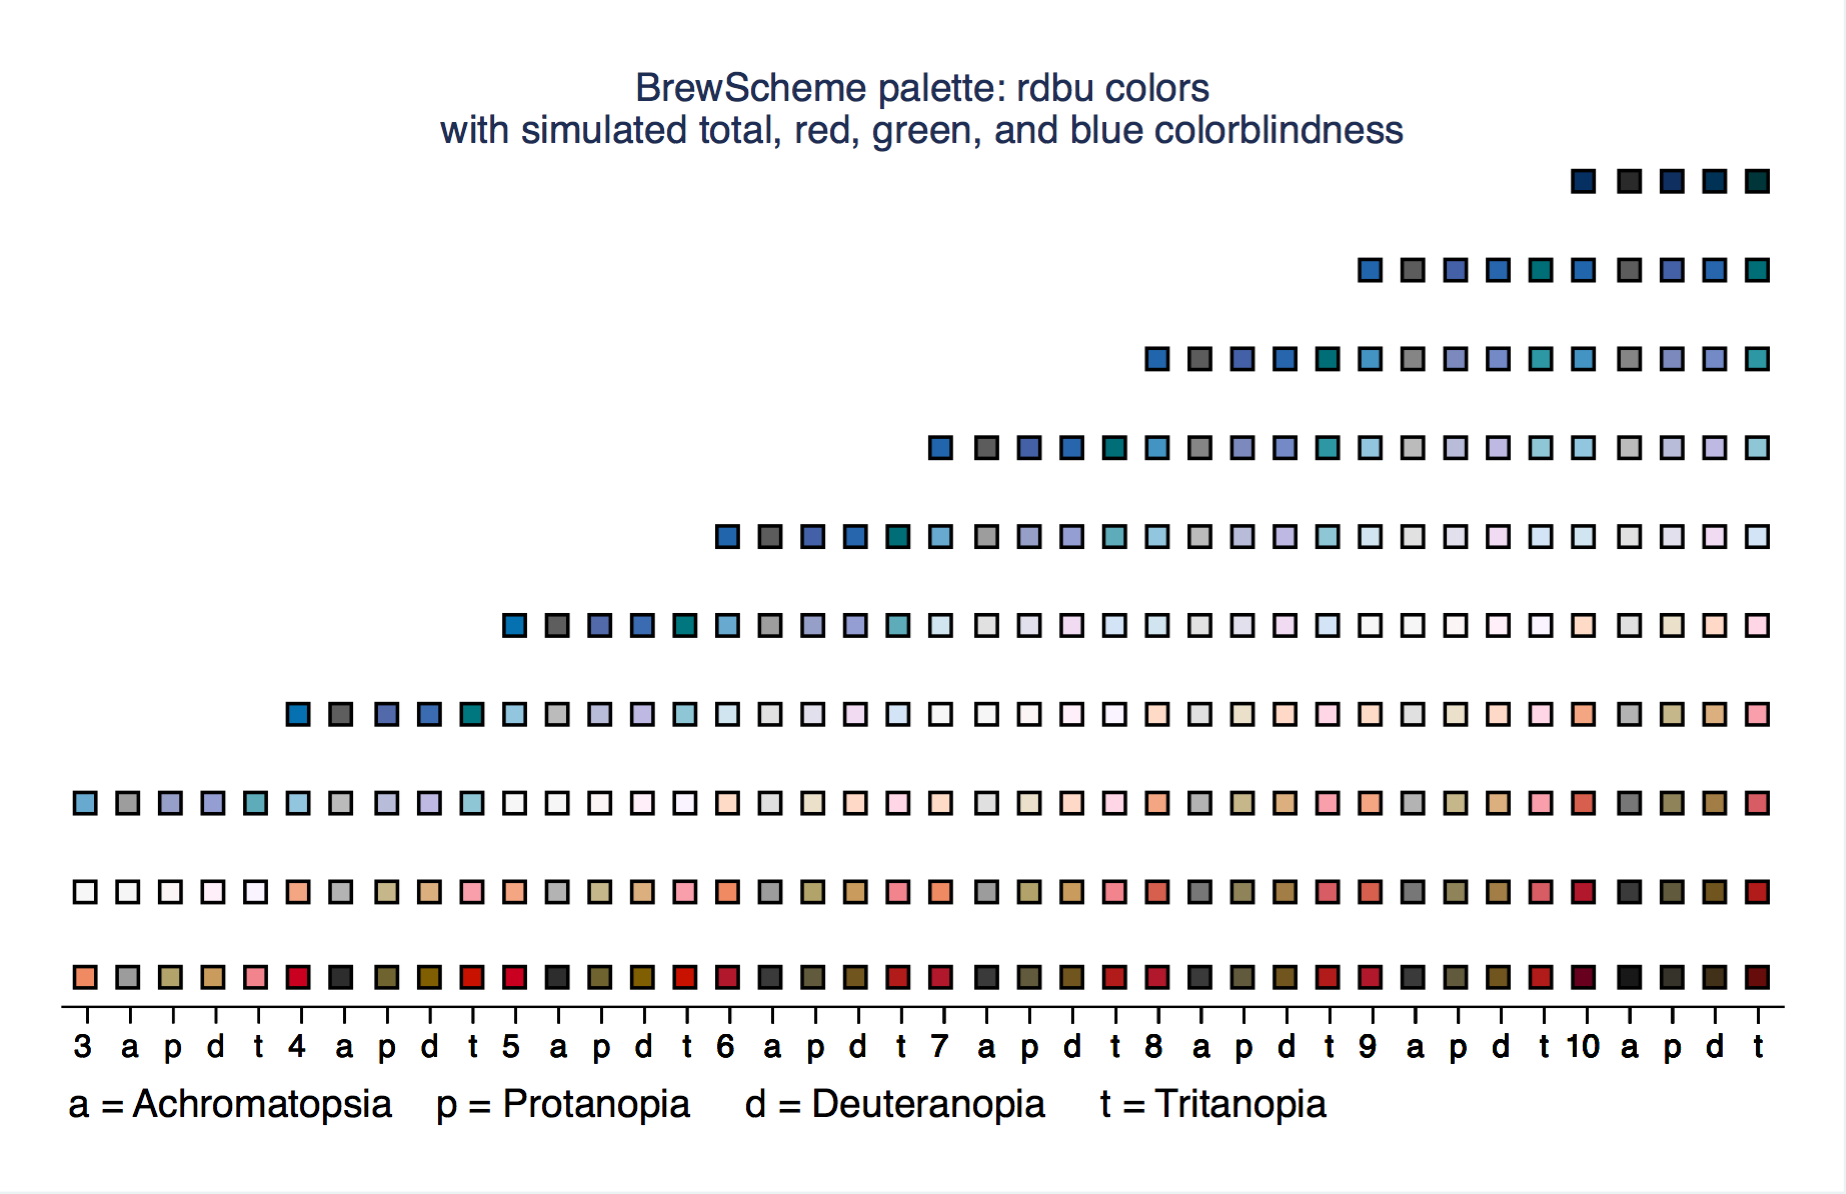 top of the gallery back to the top
rdgy
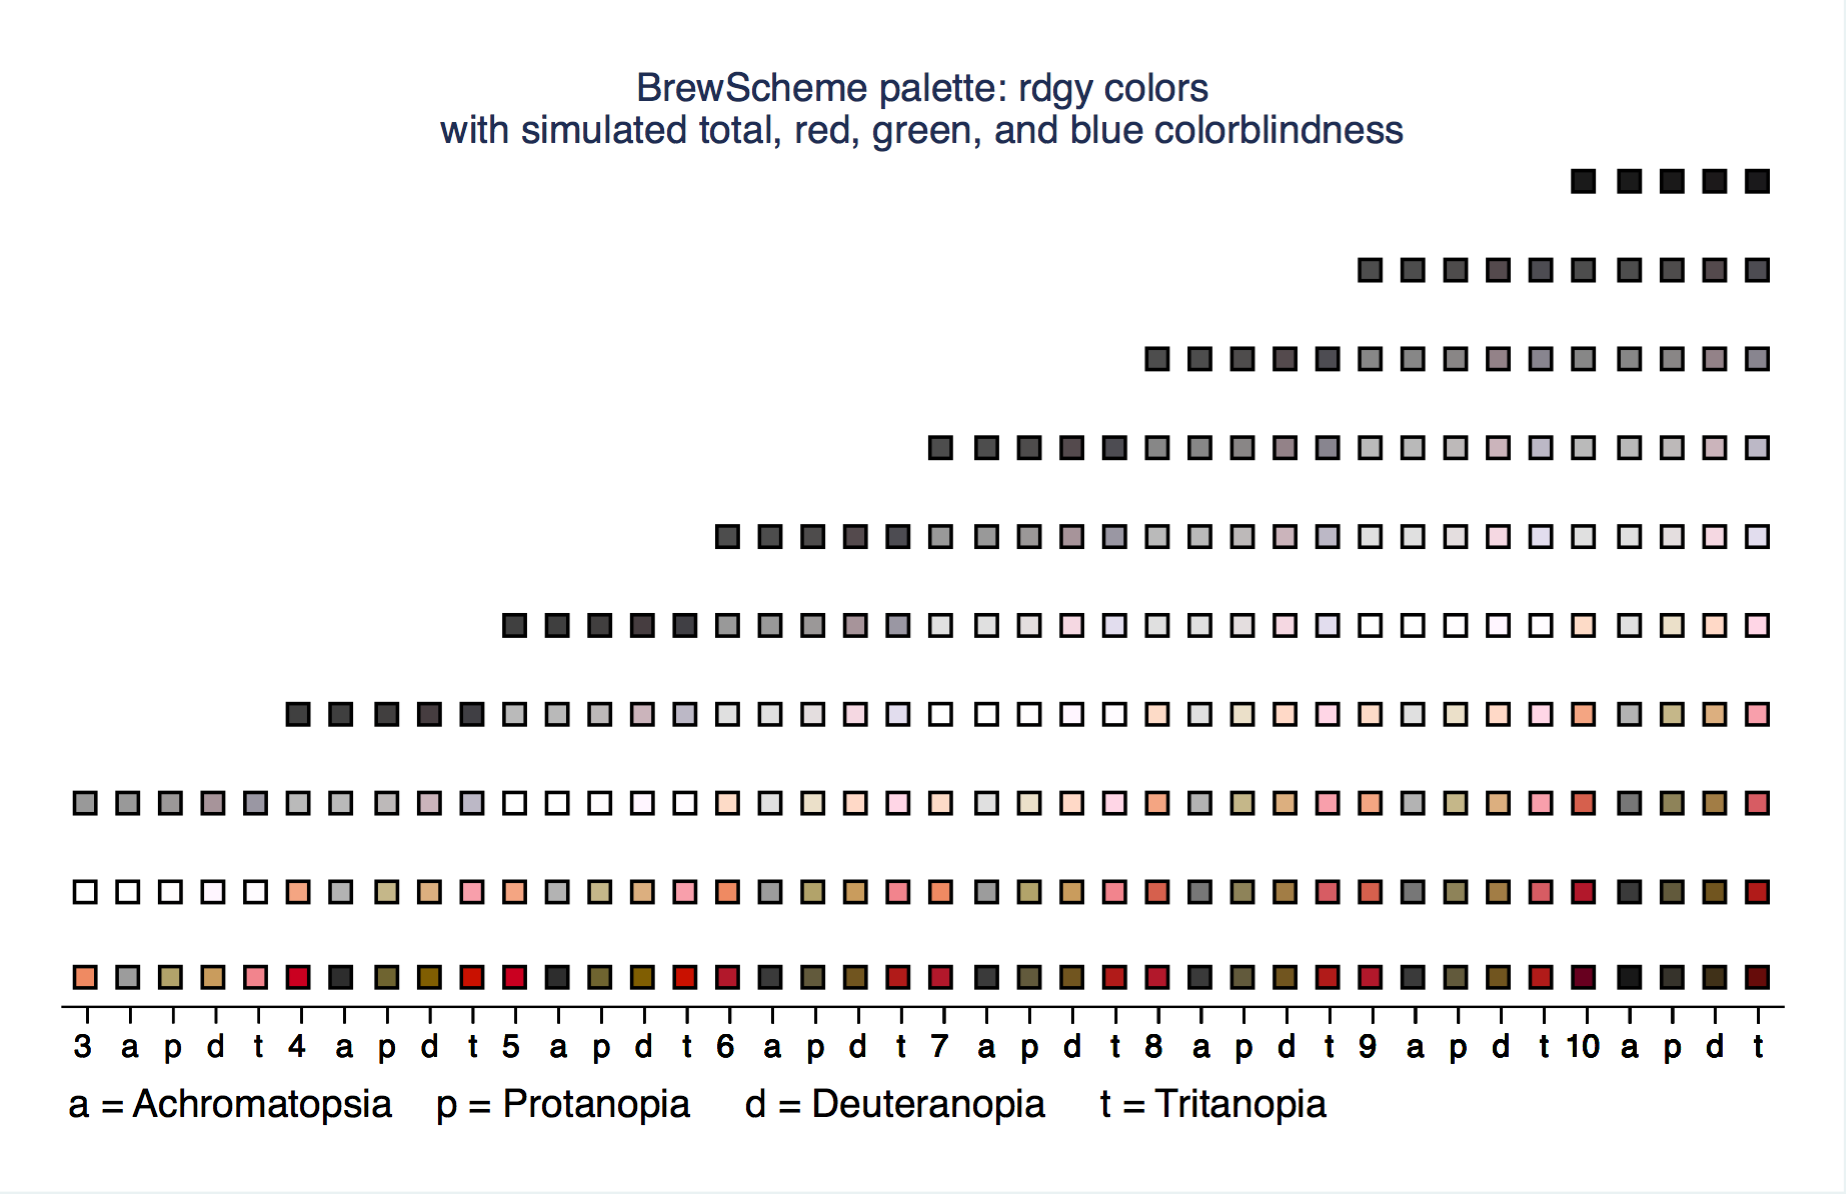 top of the gallery back to the top
rdpu
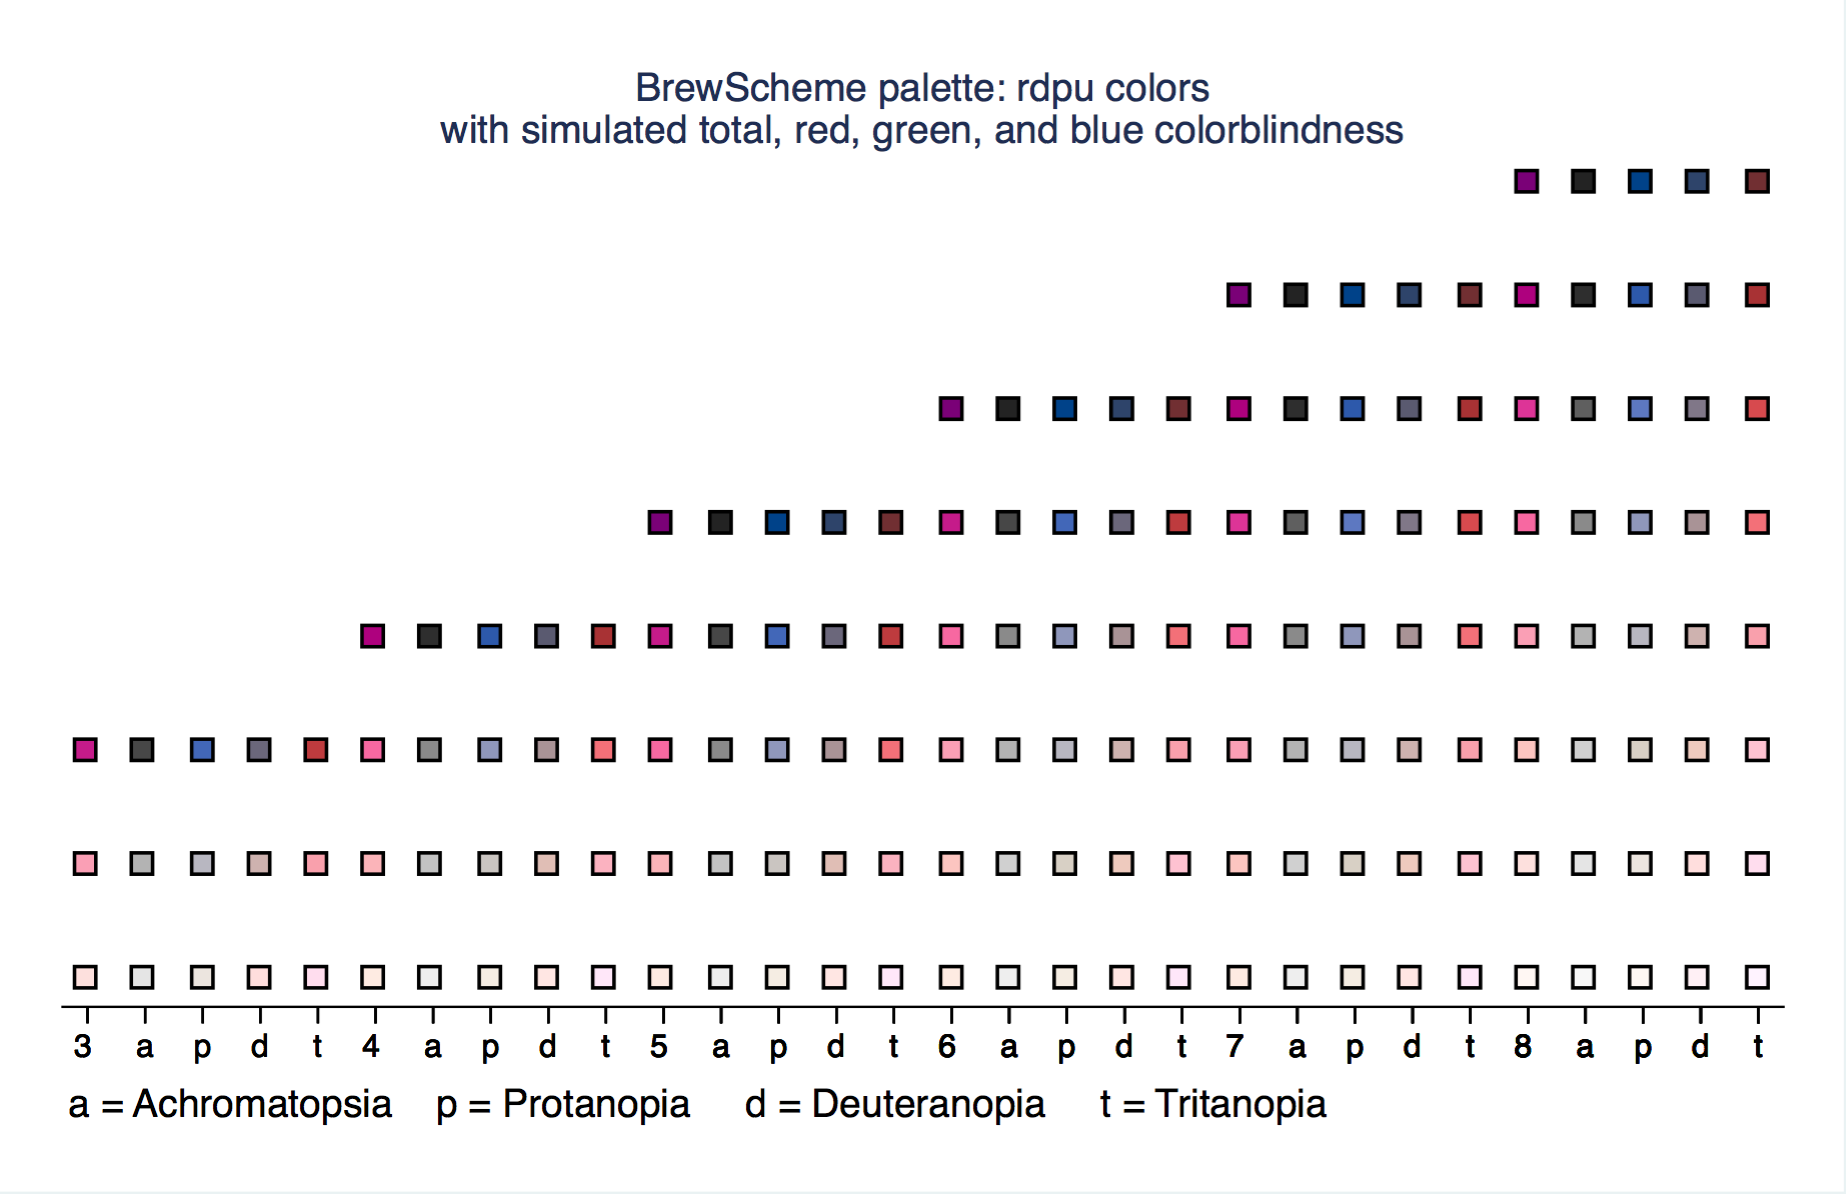 top of the gallery back to the top
rdylbu
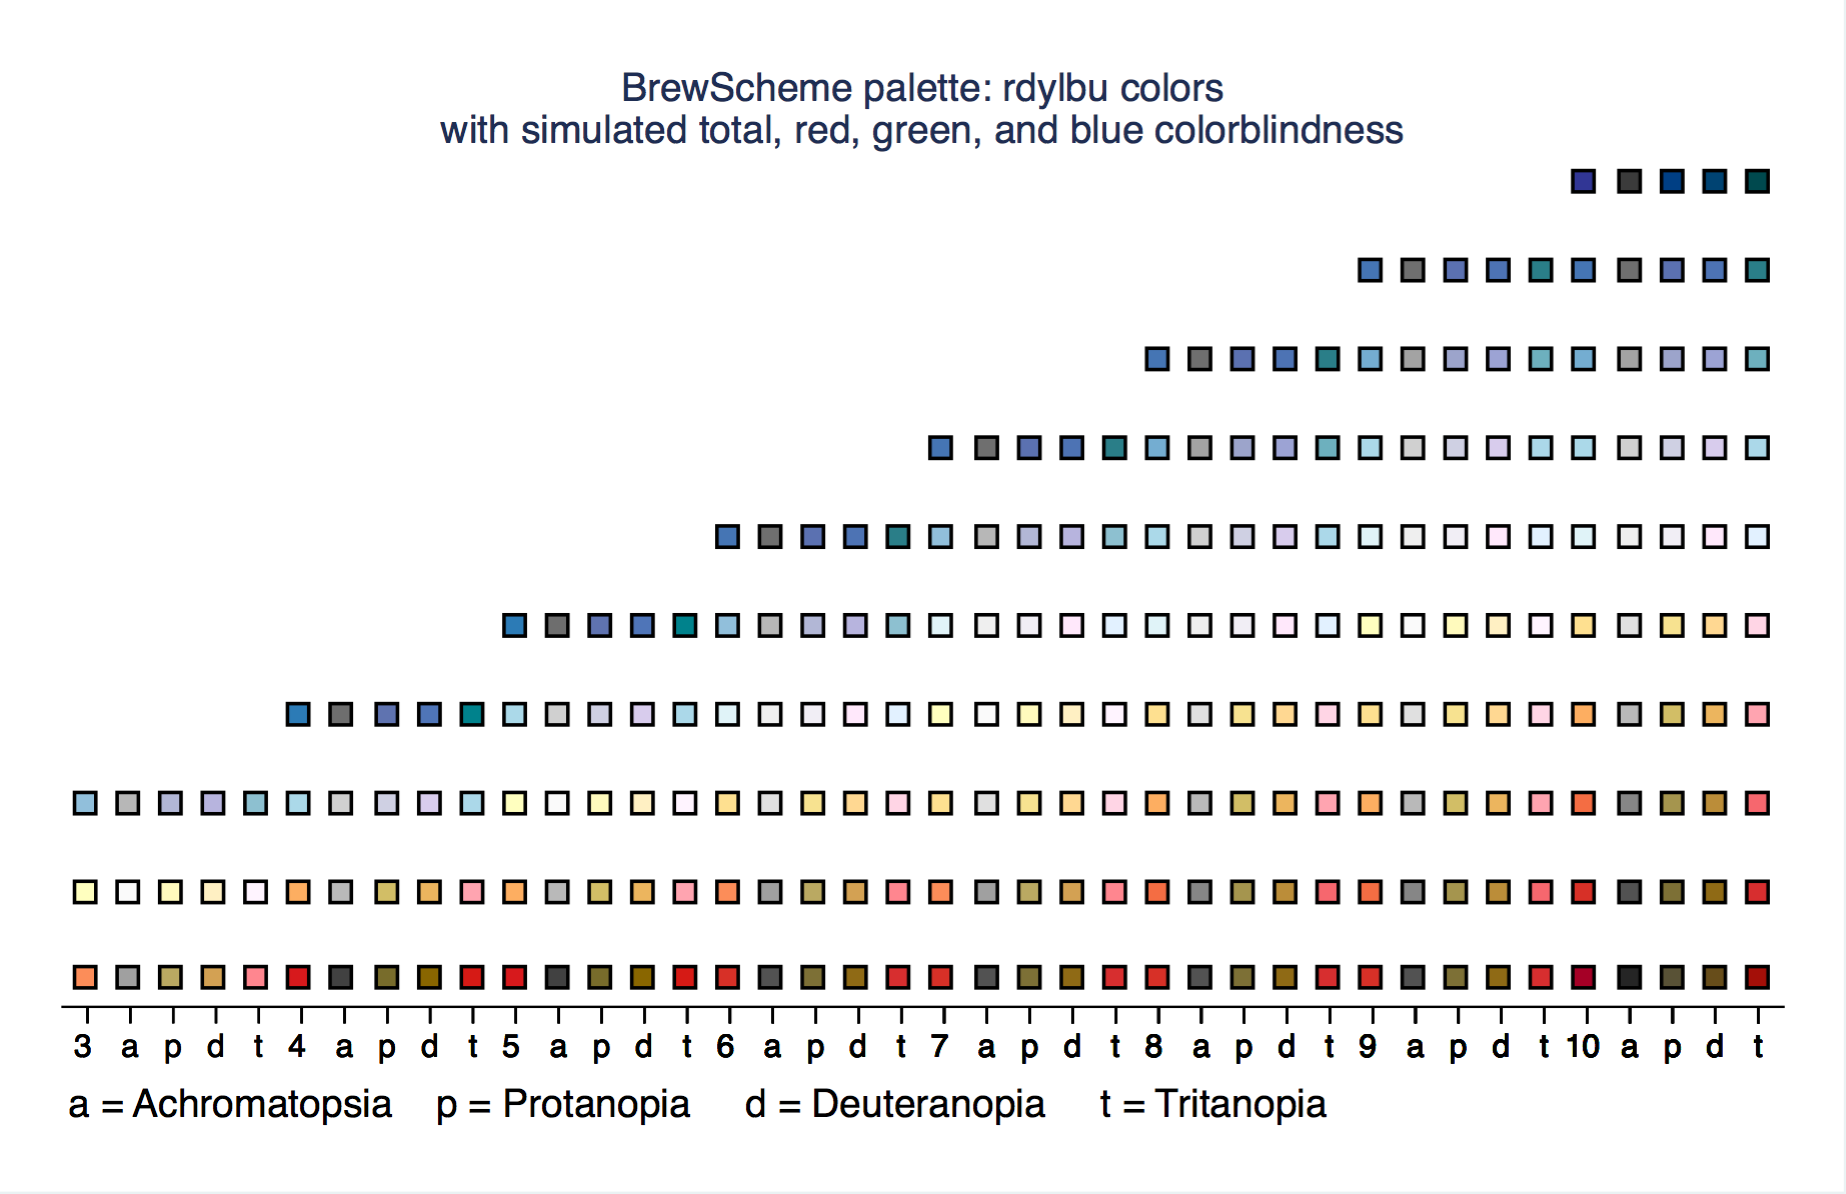 top of the gallery back to the top
rdylgn
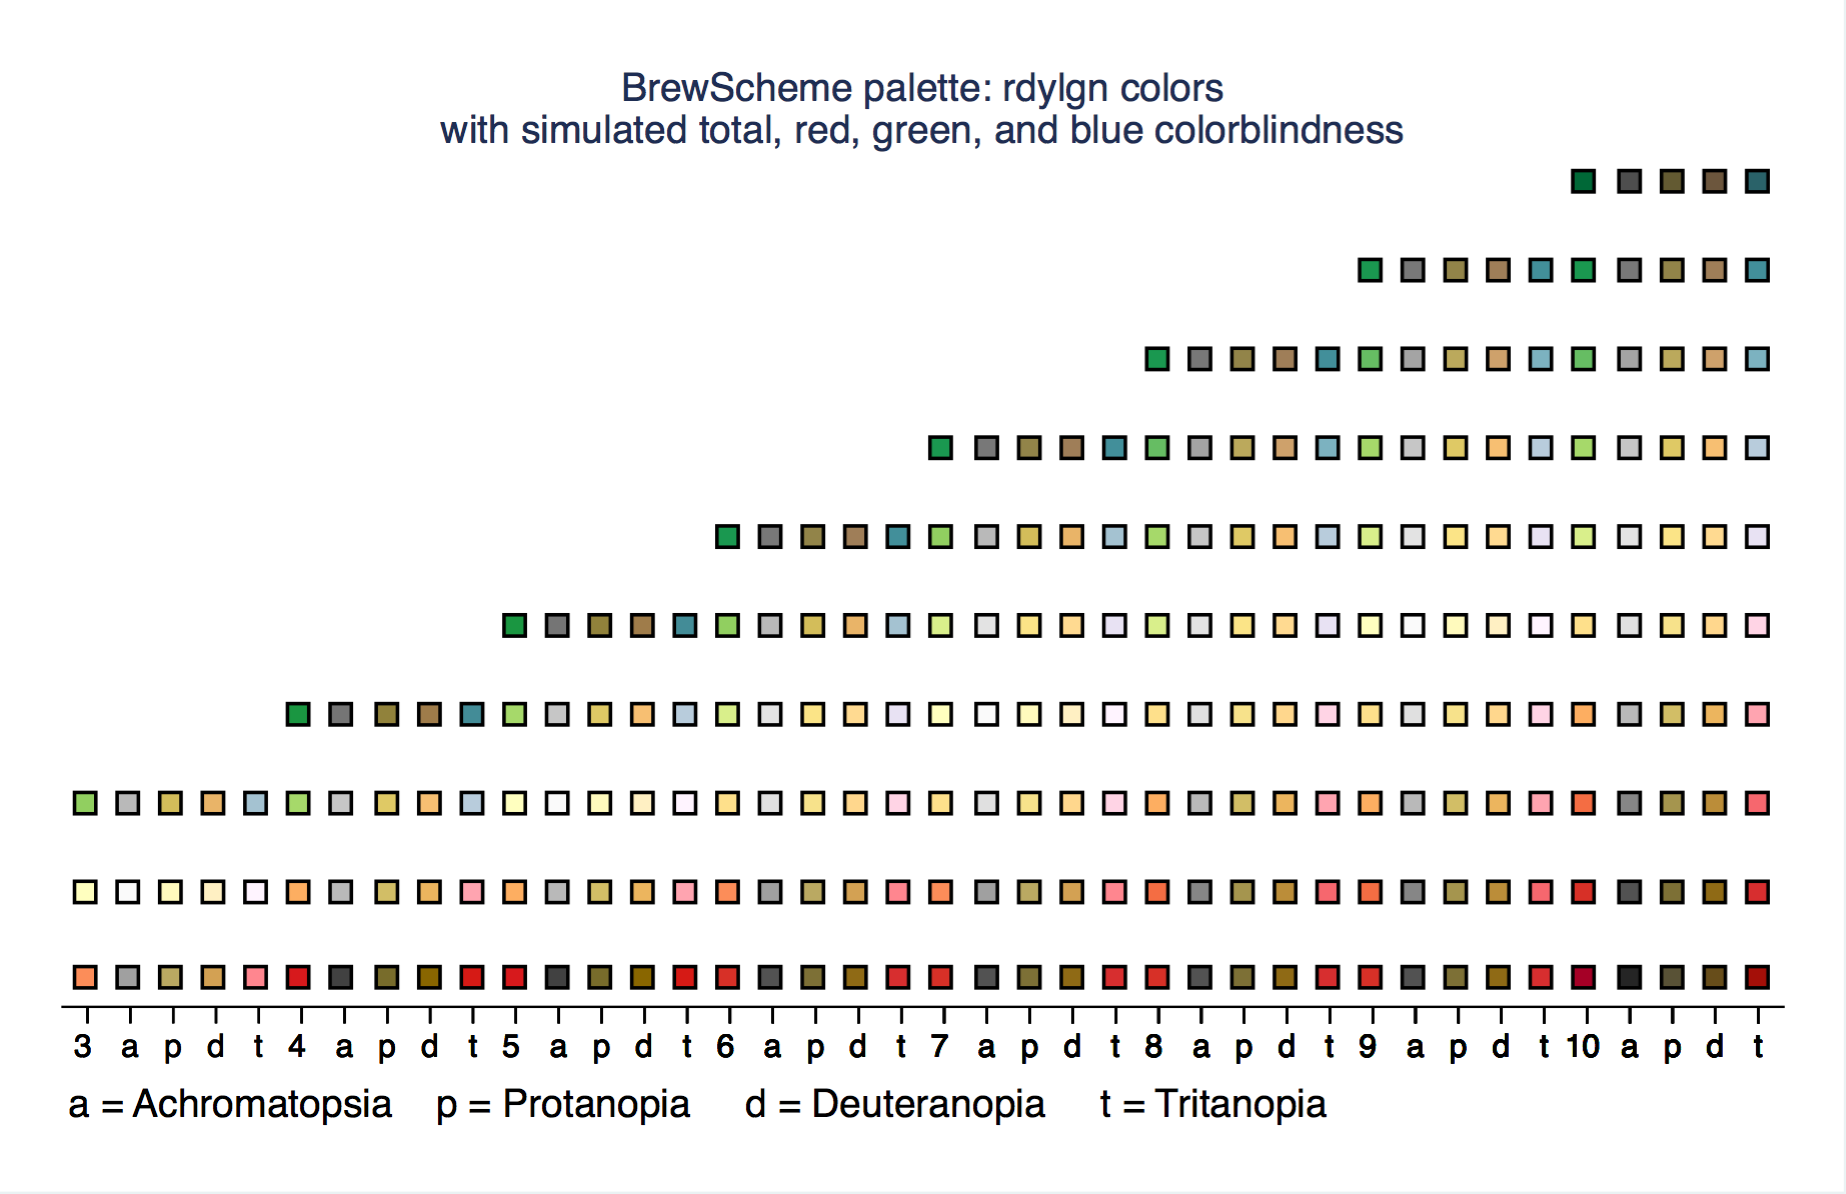 top of the gallery back to the top
reds
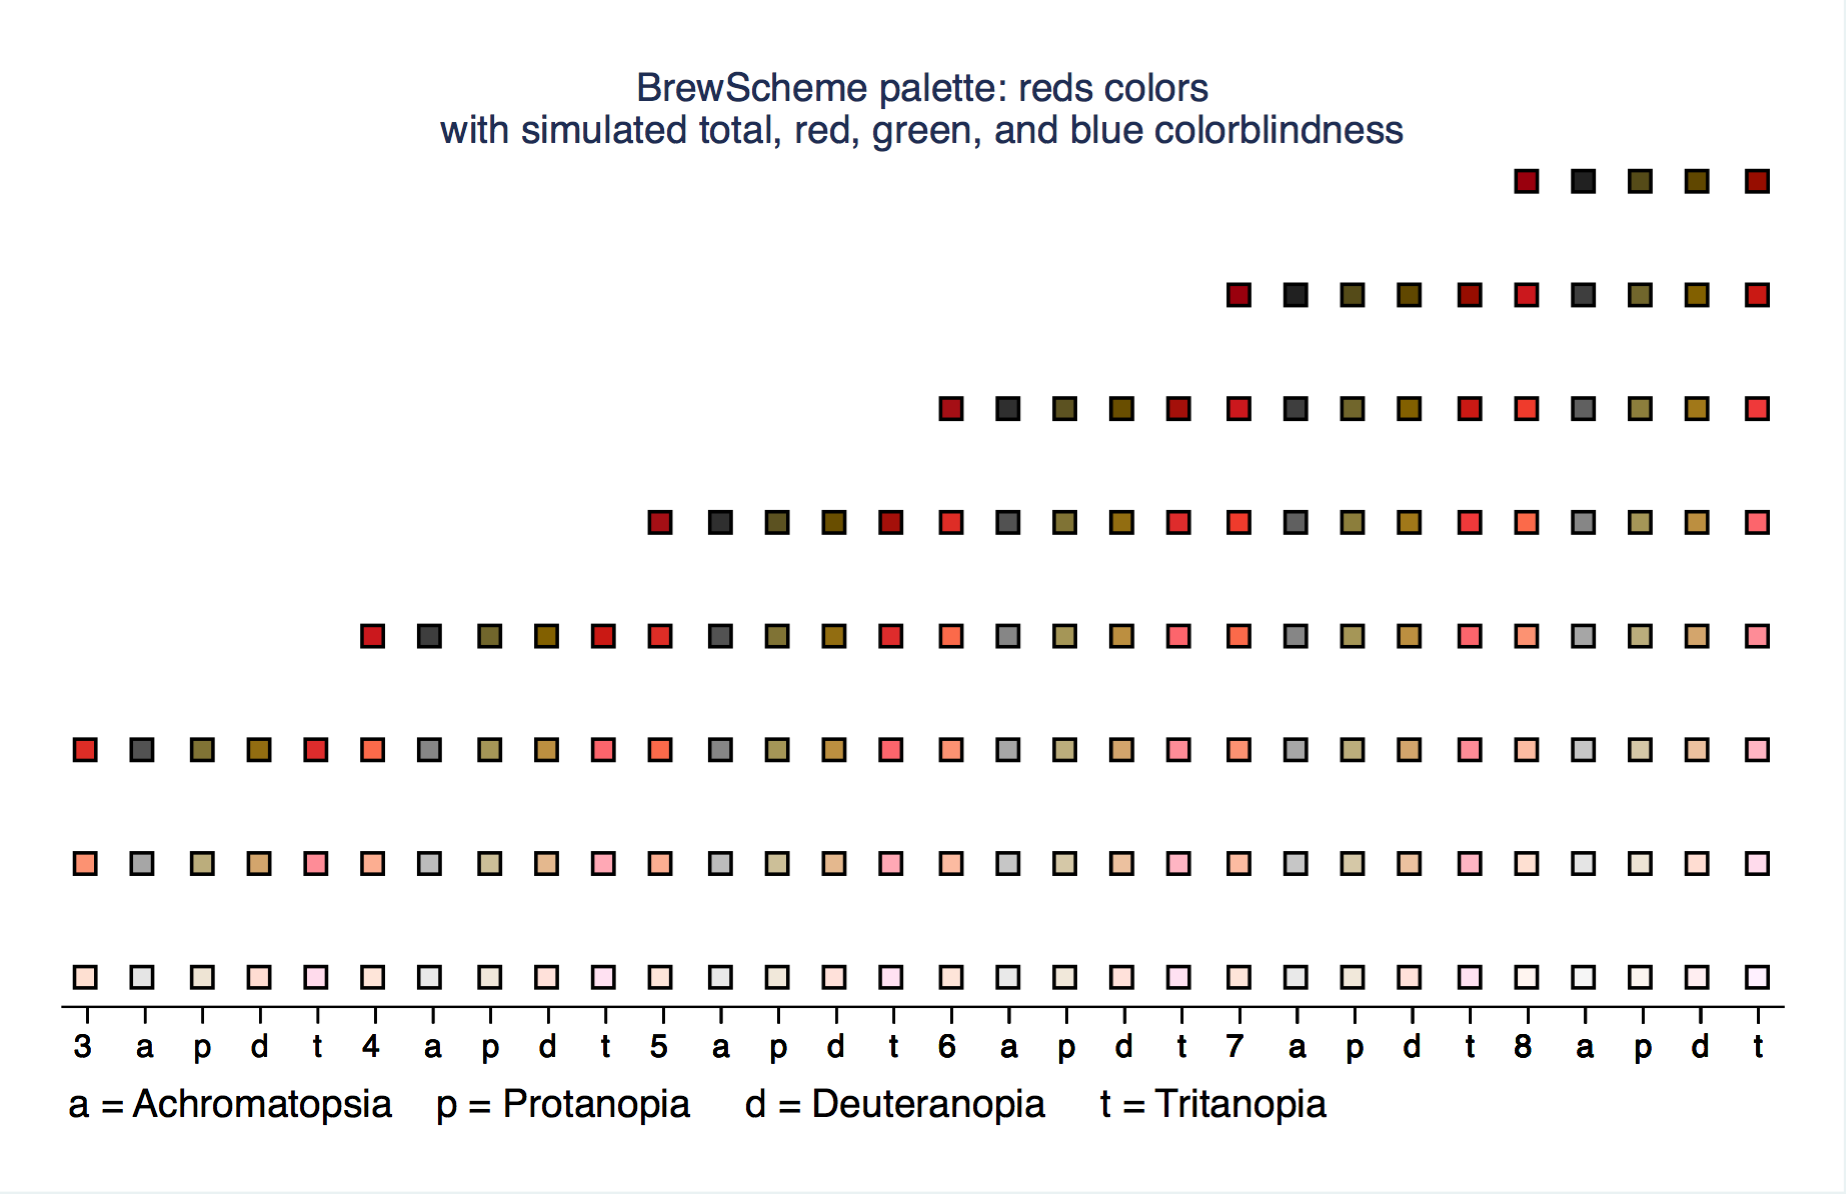 top of the gallery back to the top
set1
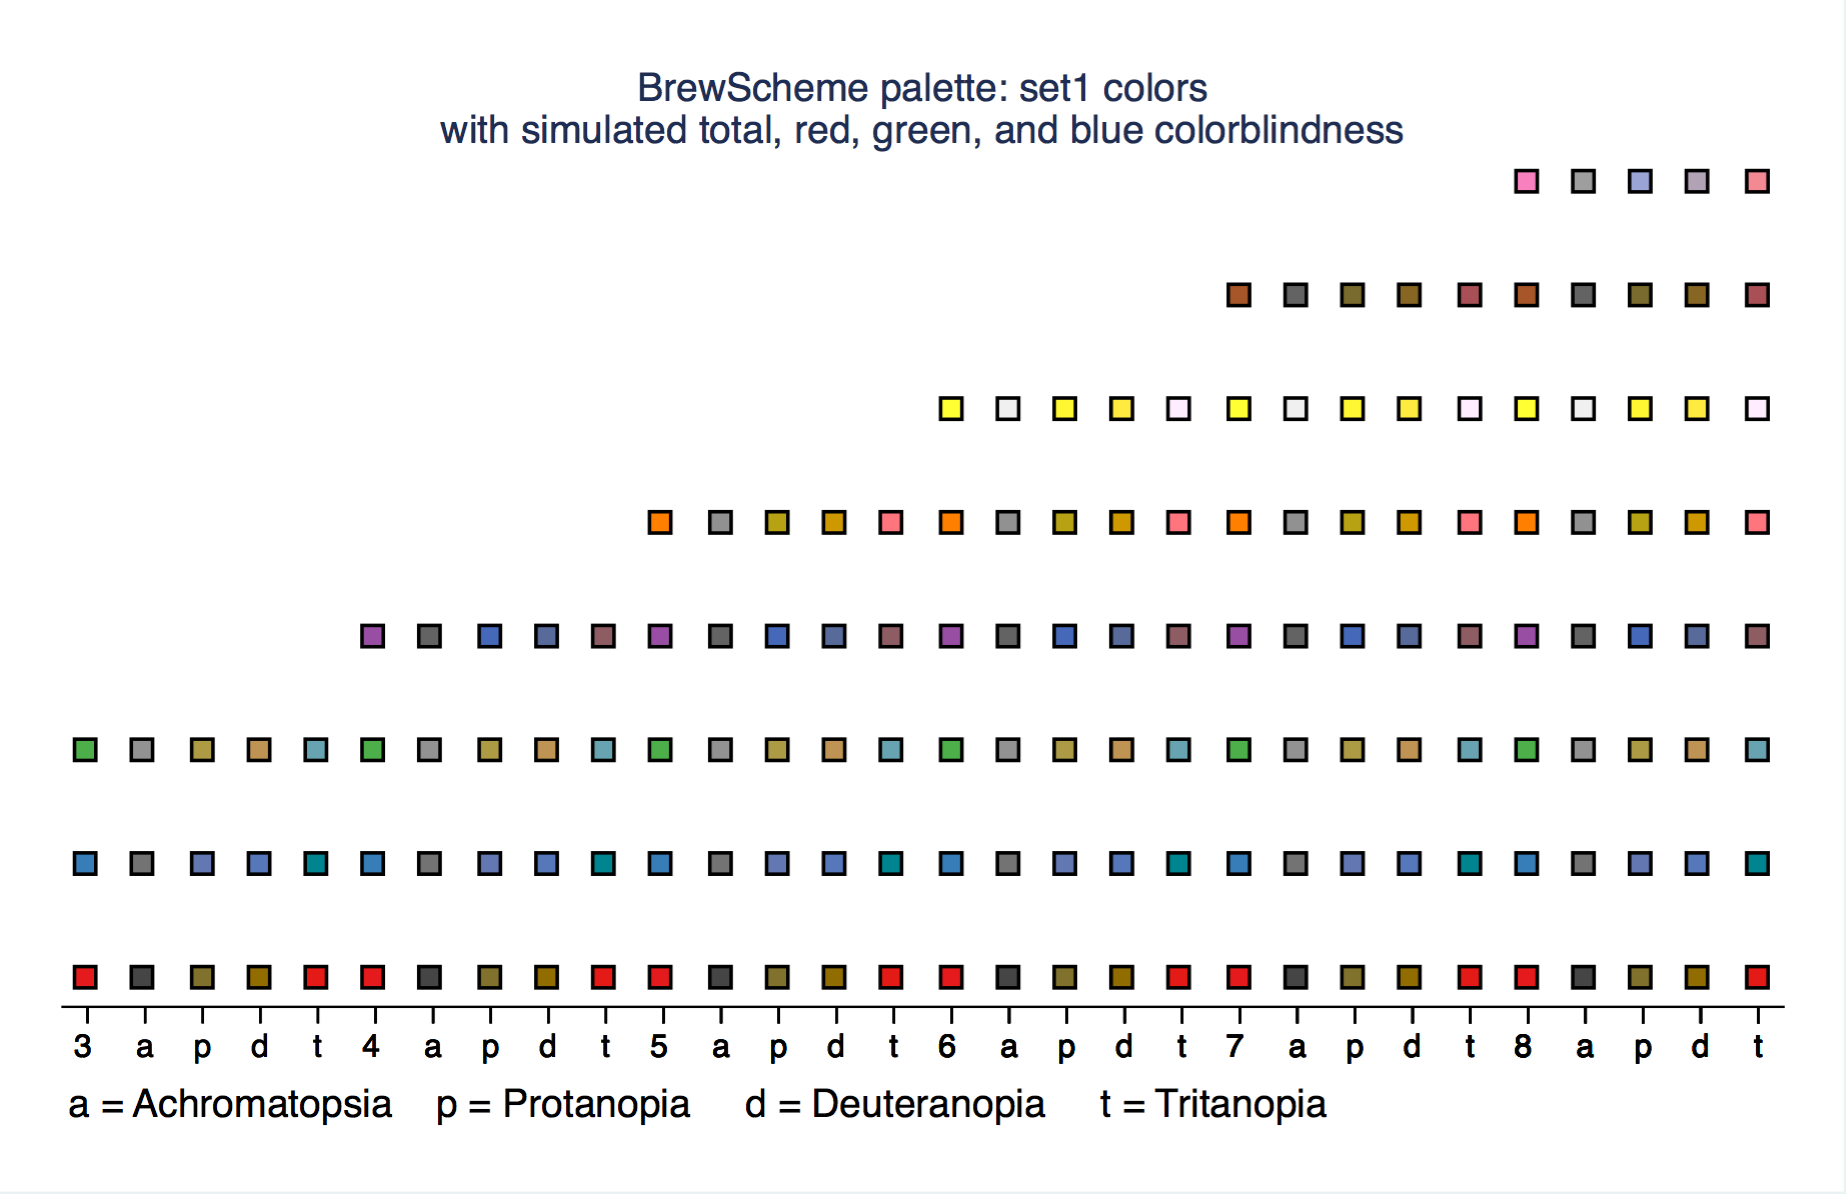 top of the gallery back to the top
set2
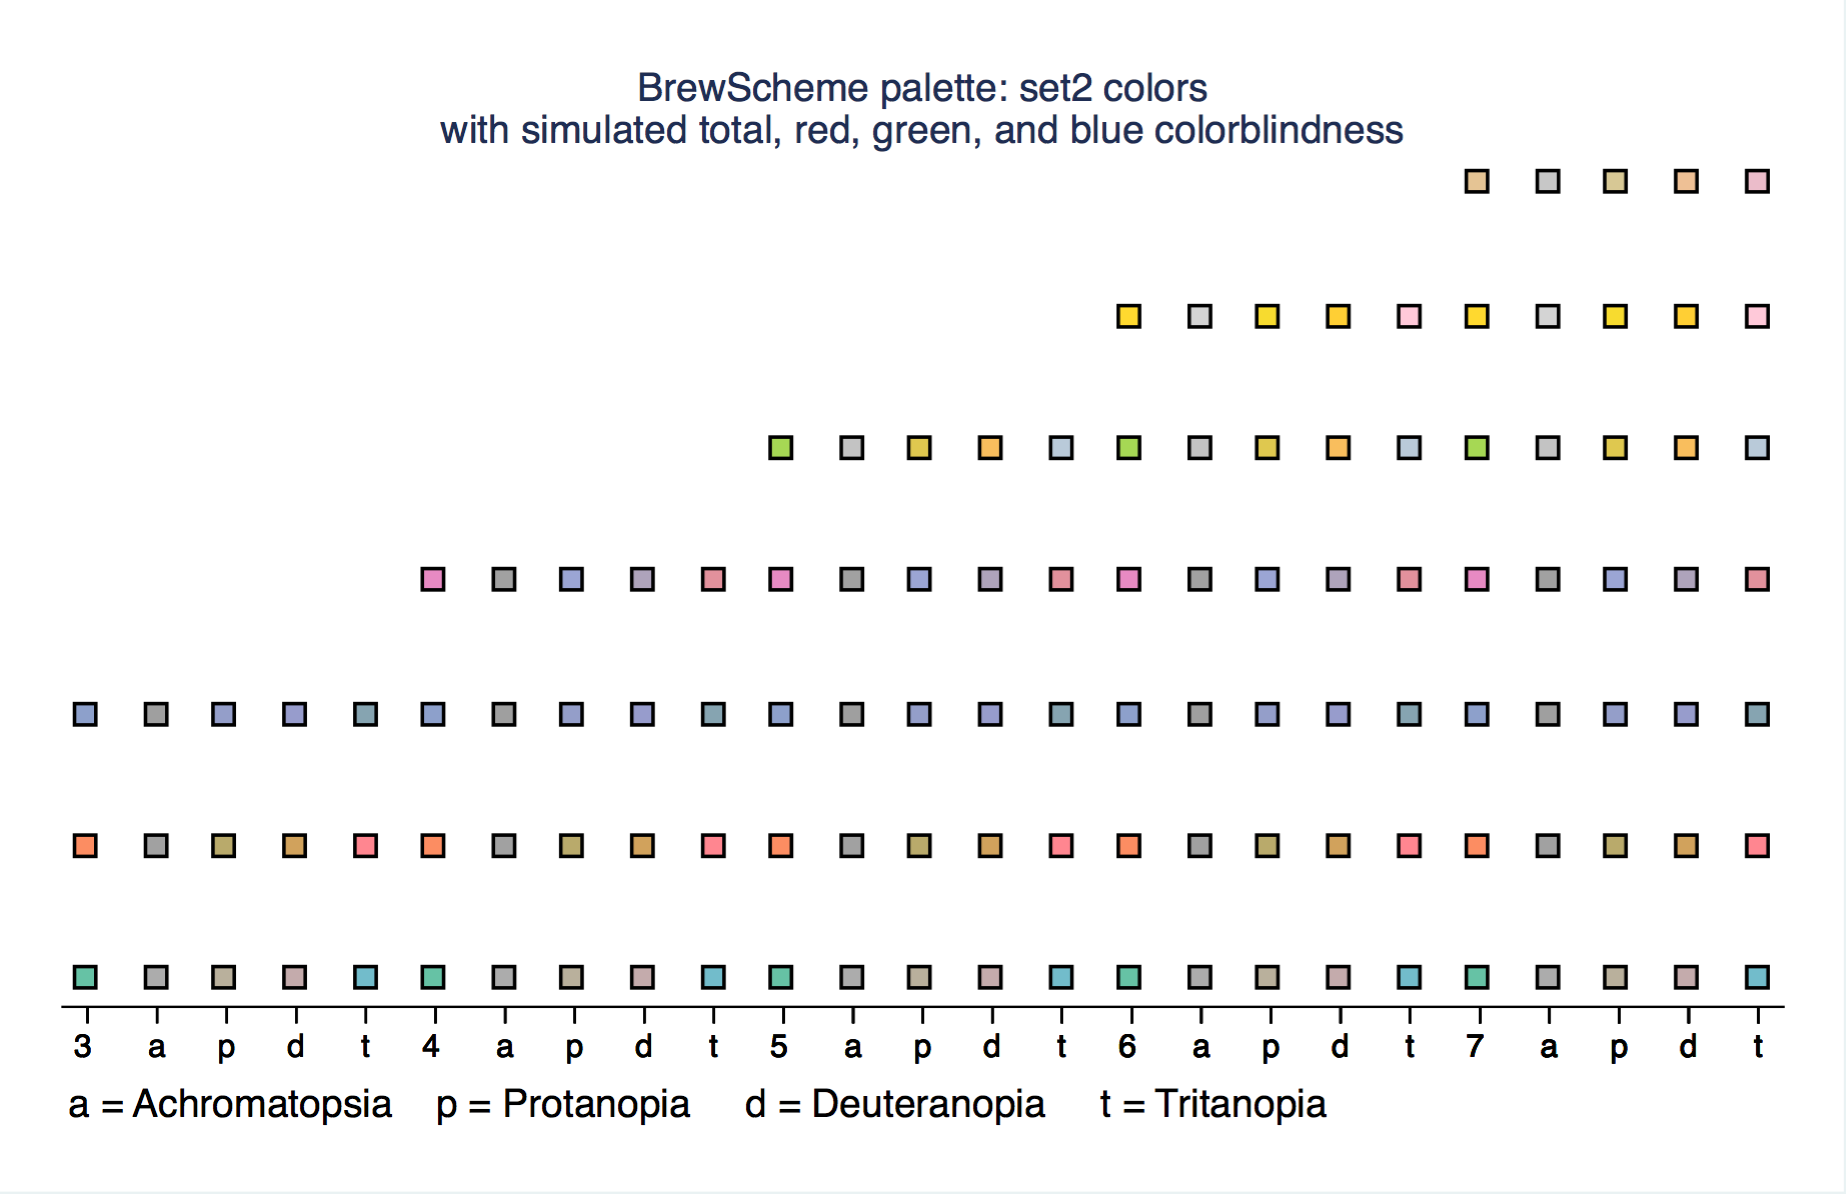 top of the gallery back to the top
set3
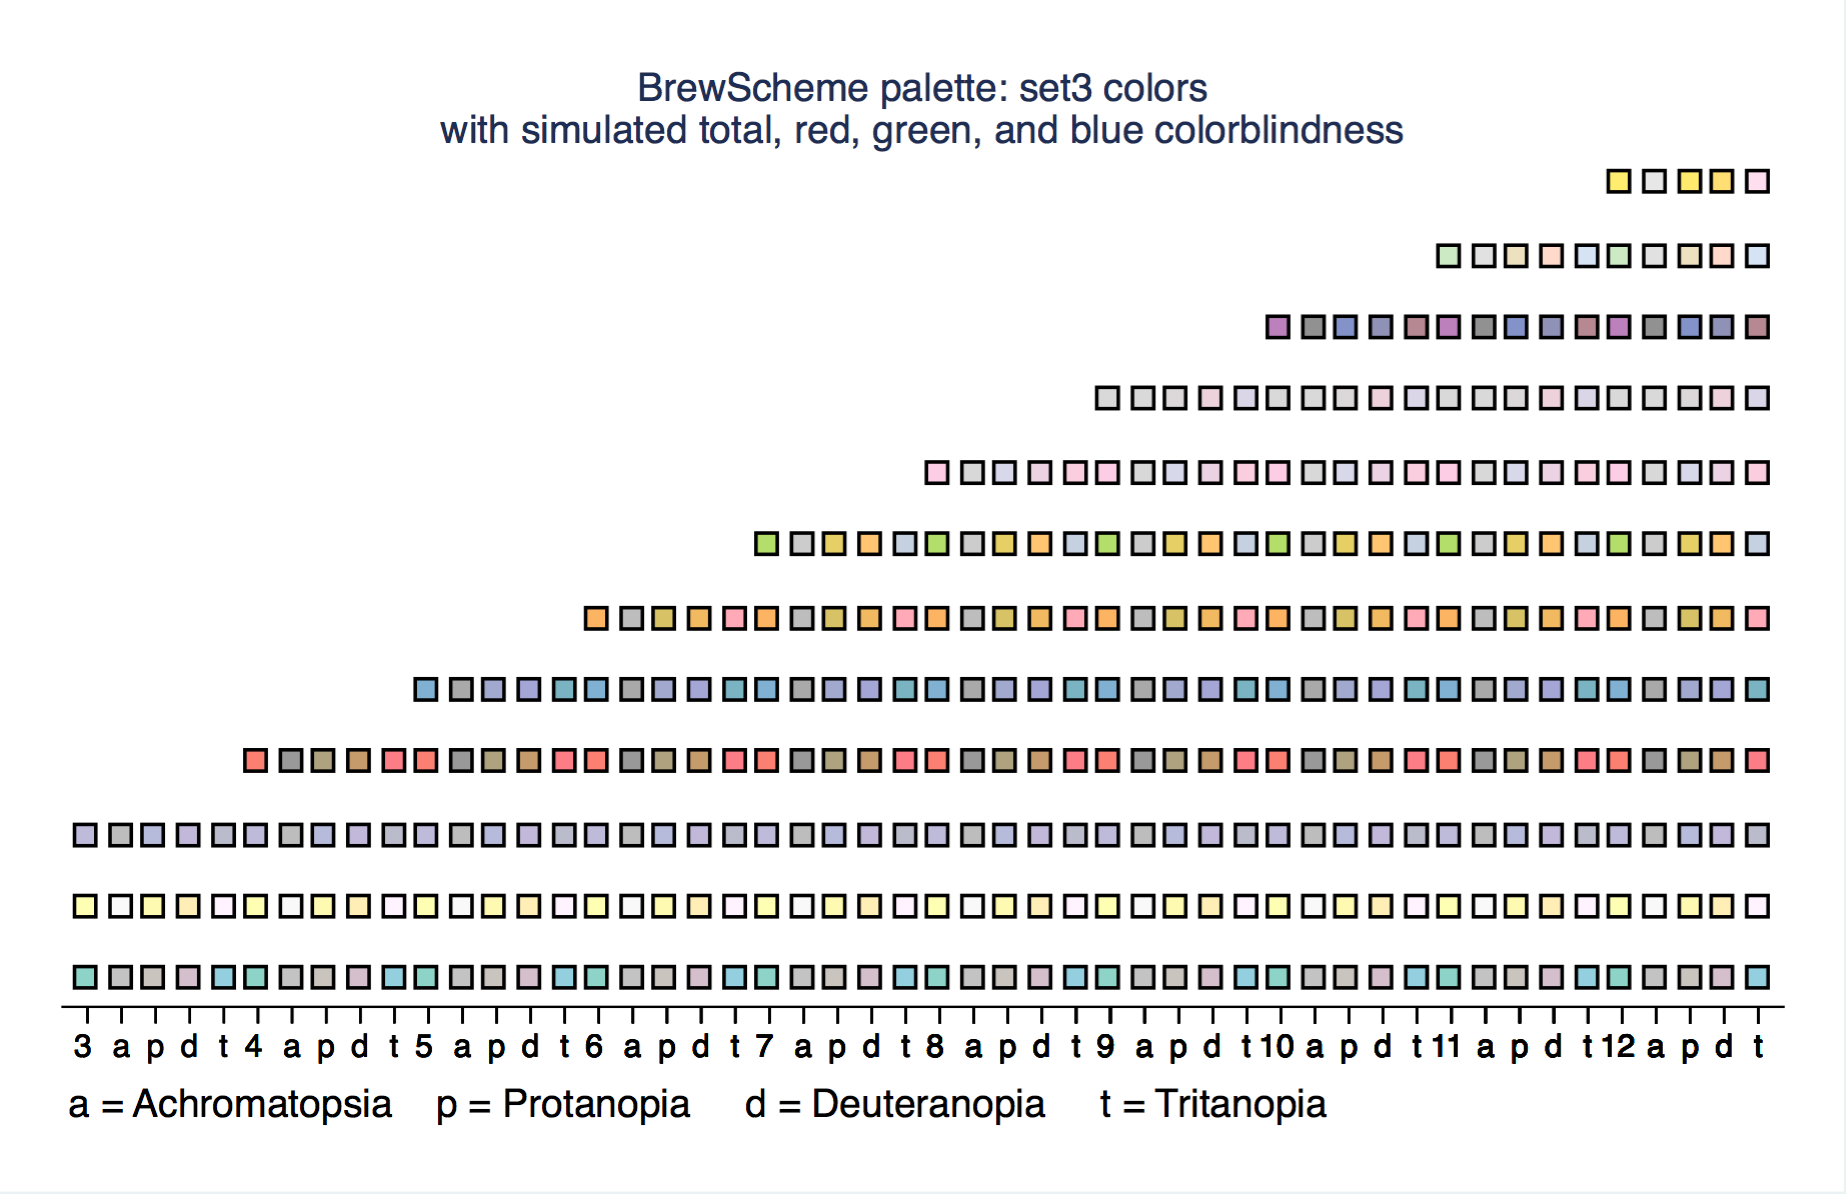 top of the gallery back to the top
spectral
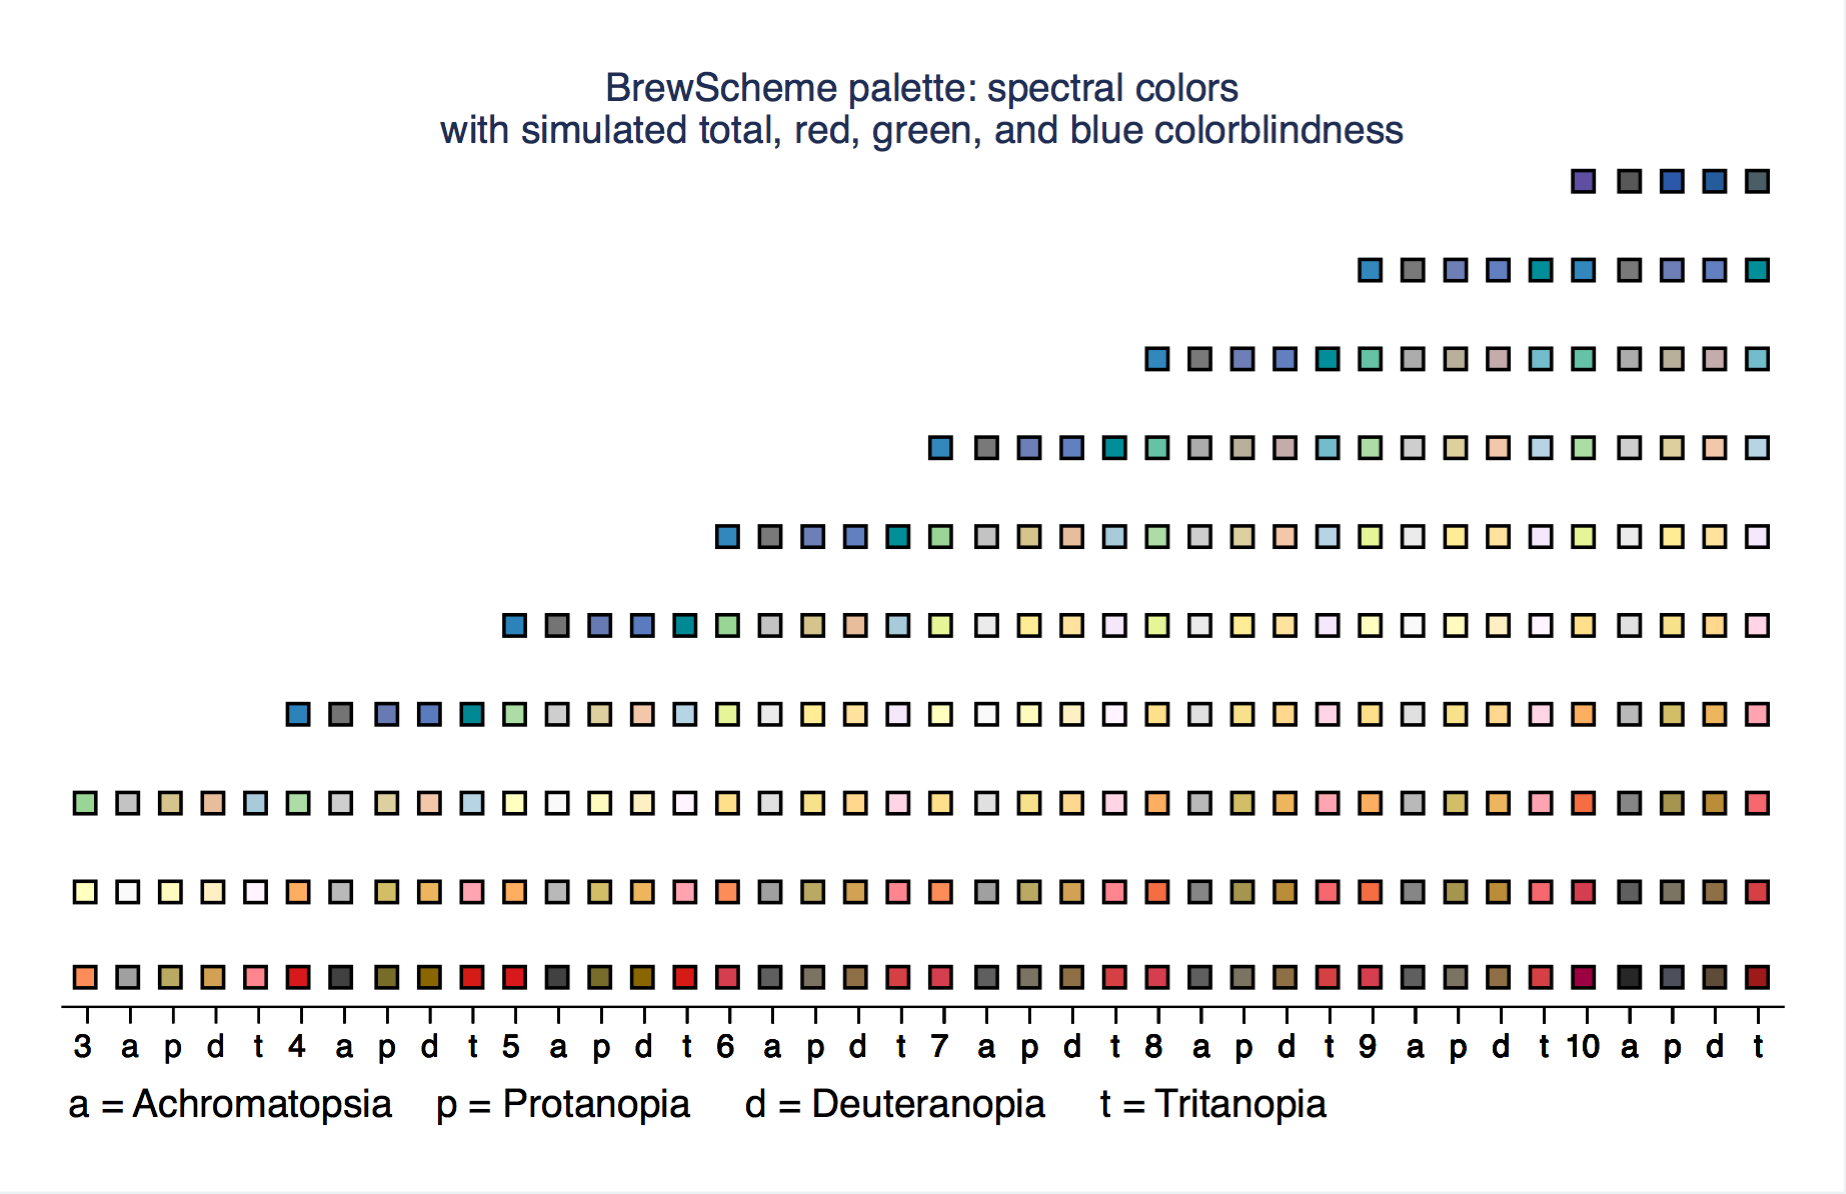 top of the gallery back to the top
tableau
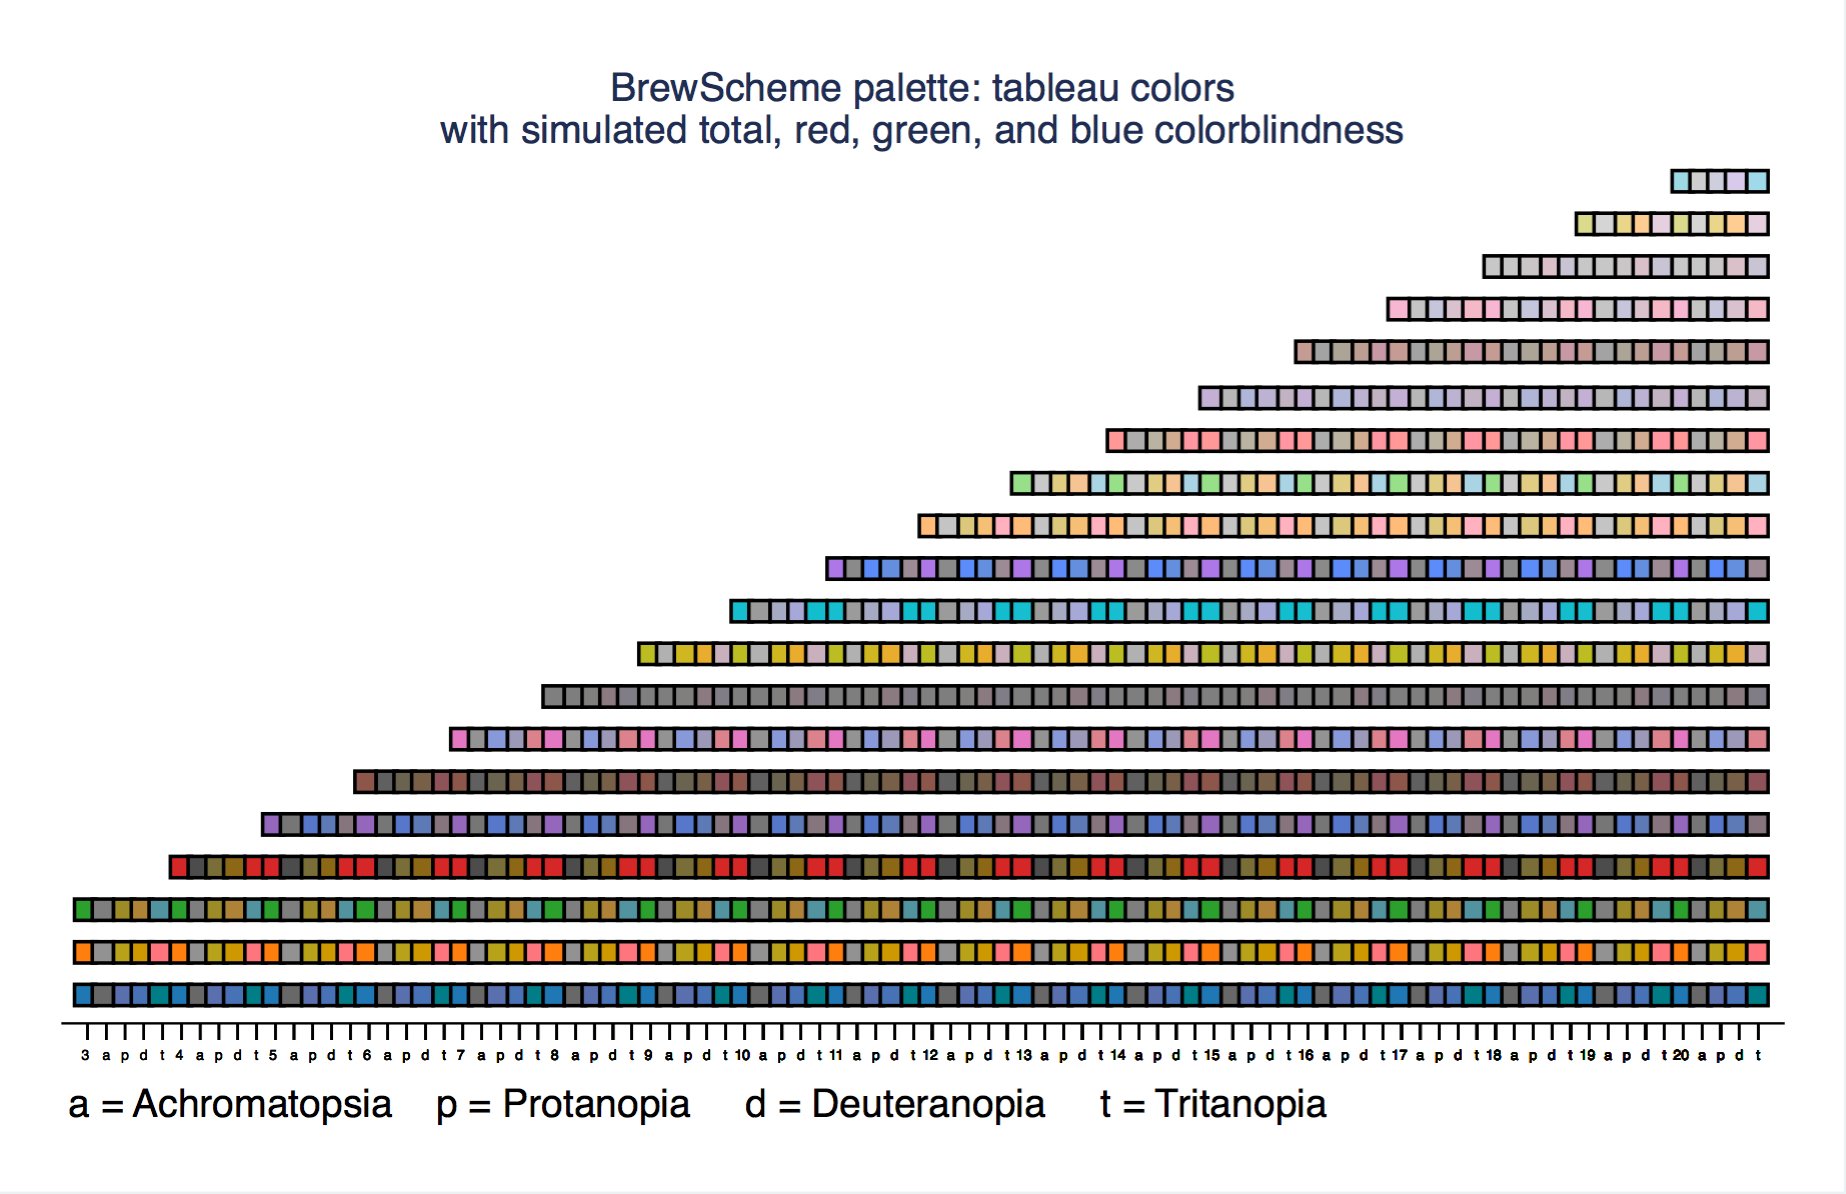 top of the gallery back to the top
veggiesa
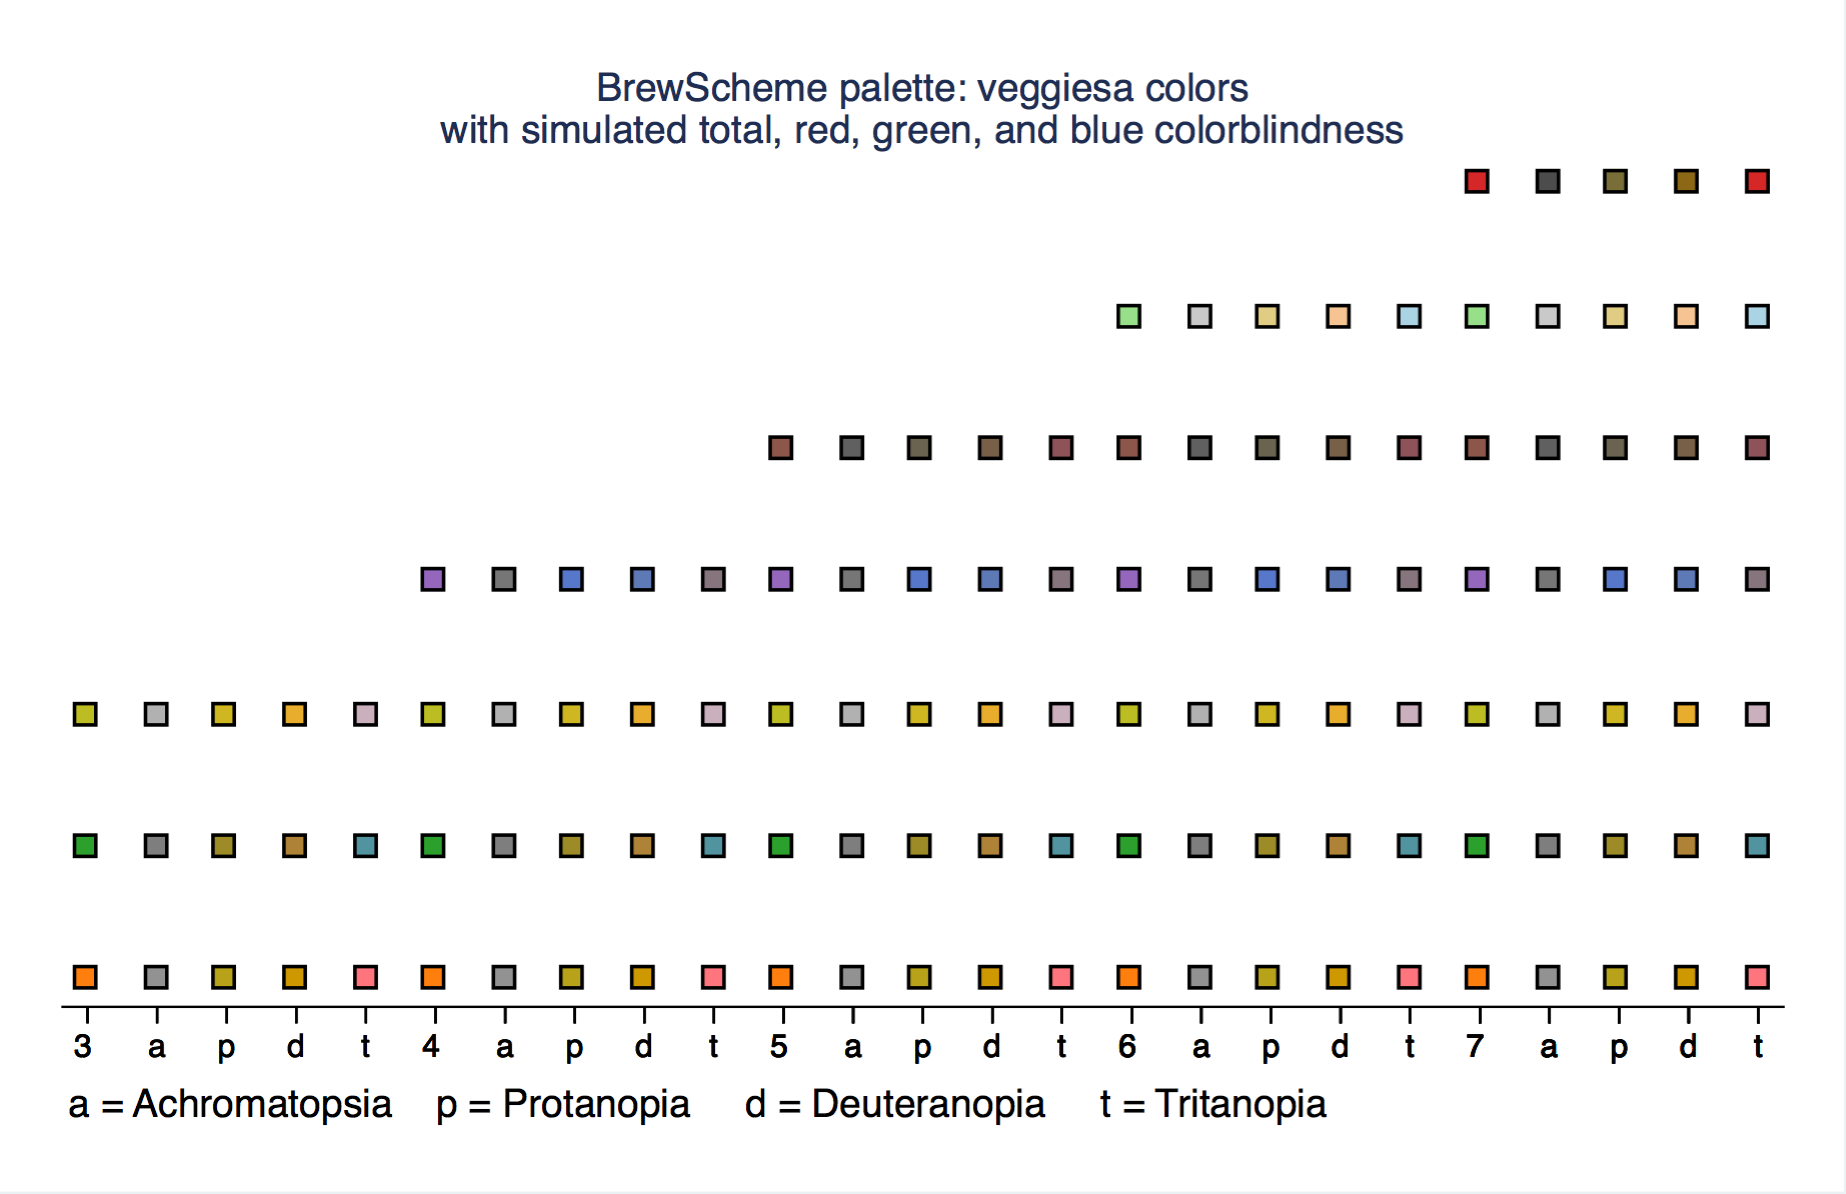 top of the gallery back to the top
veggiese
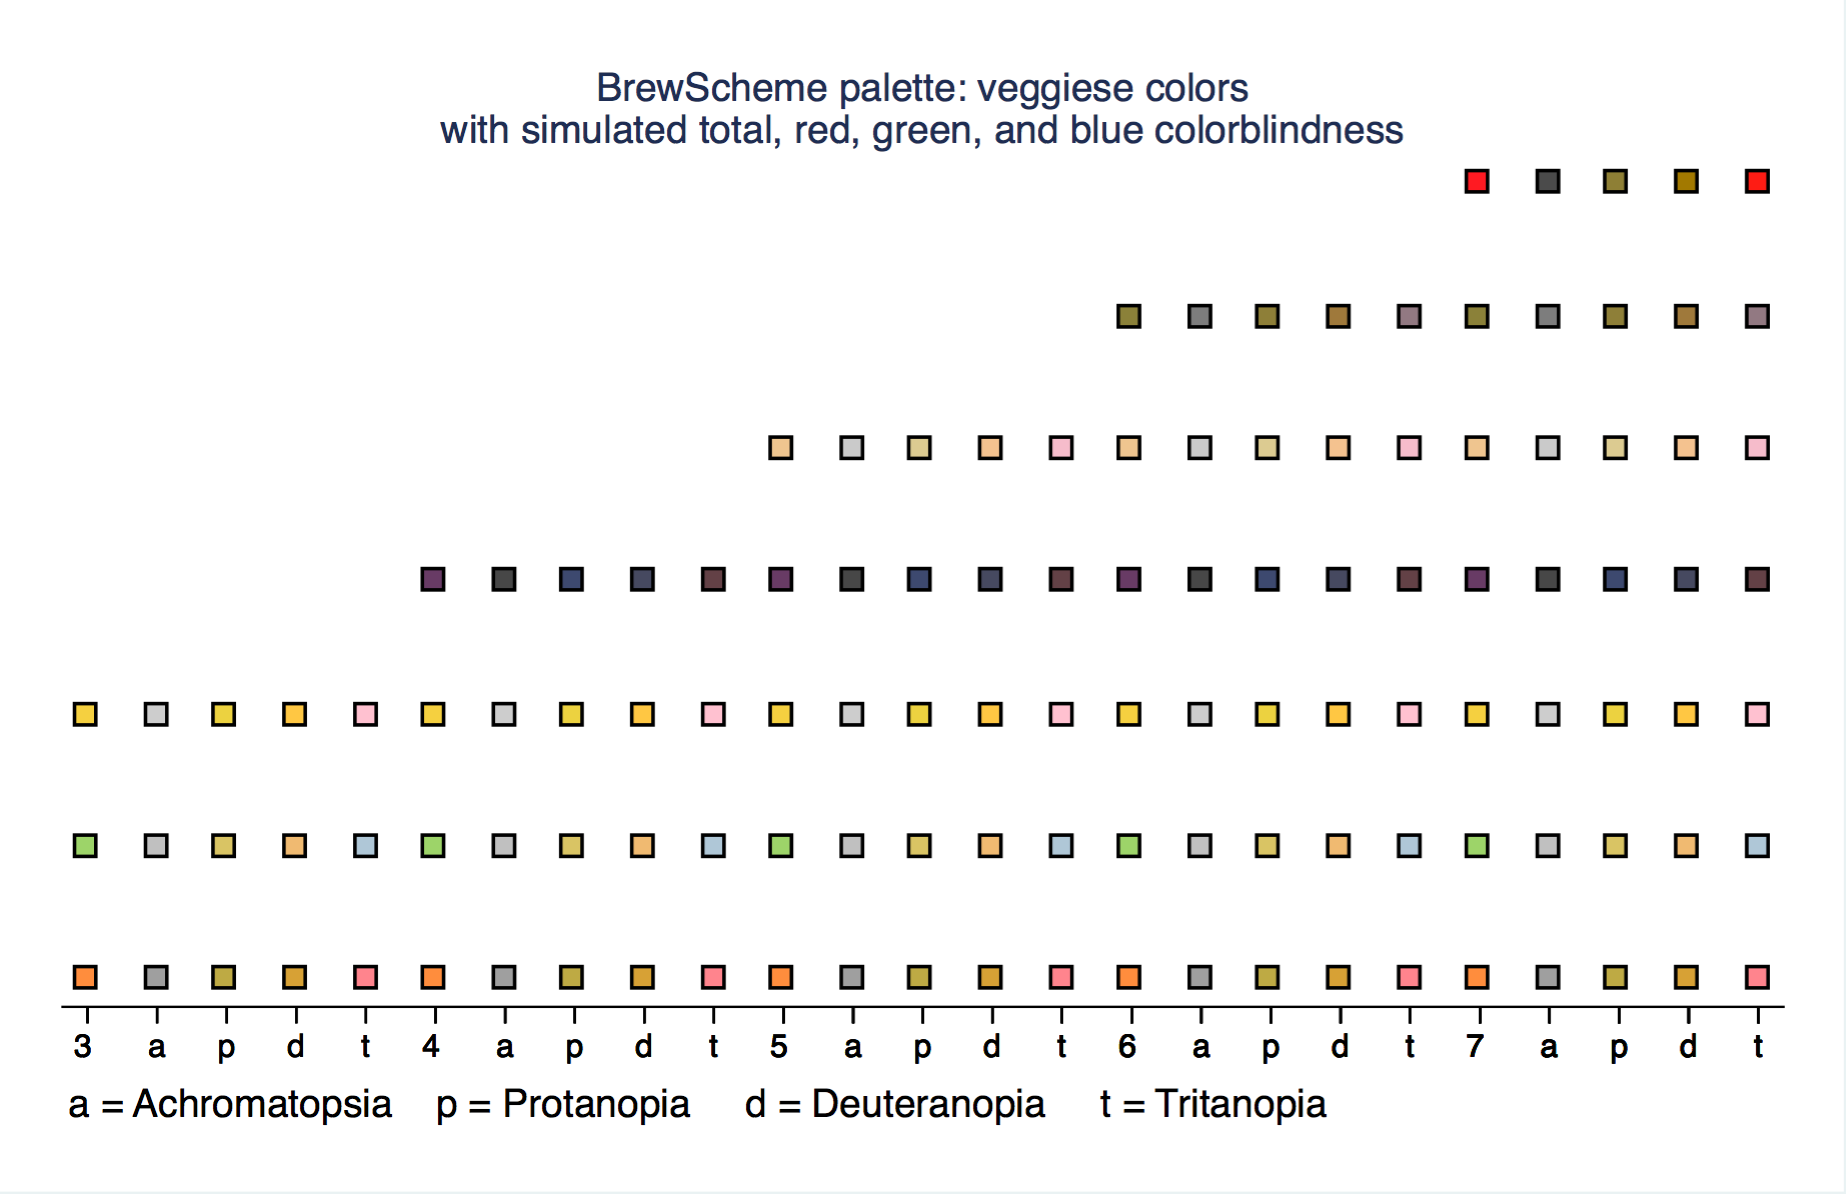 top of the gallery back to the top
ylgn
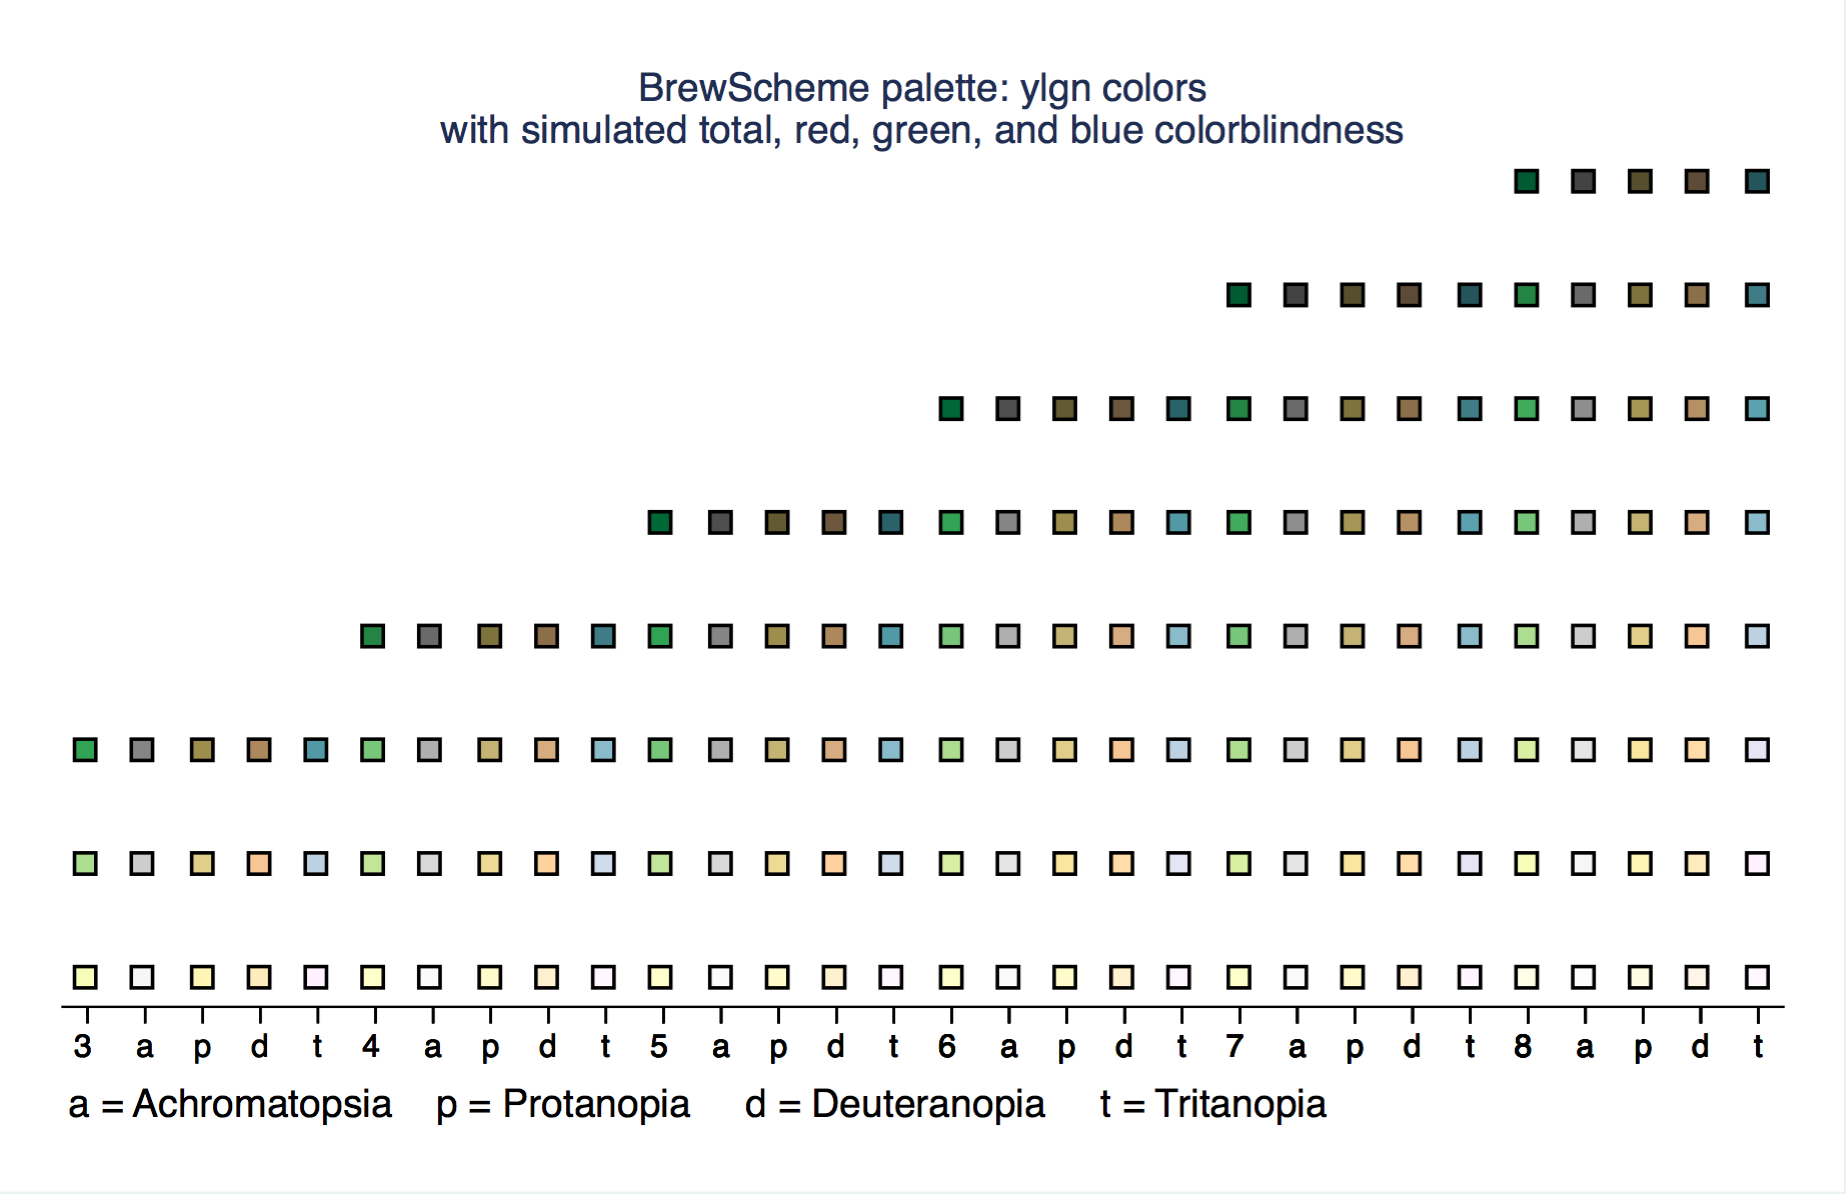 top of the gallery back to the top
ylgnbu
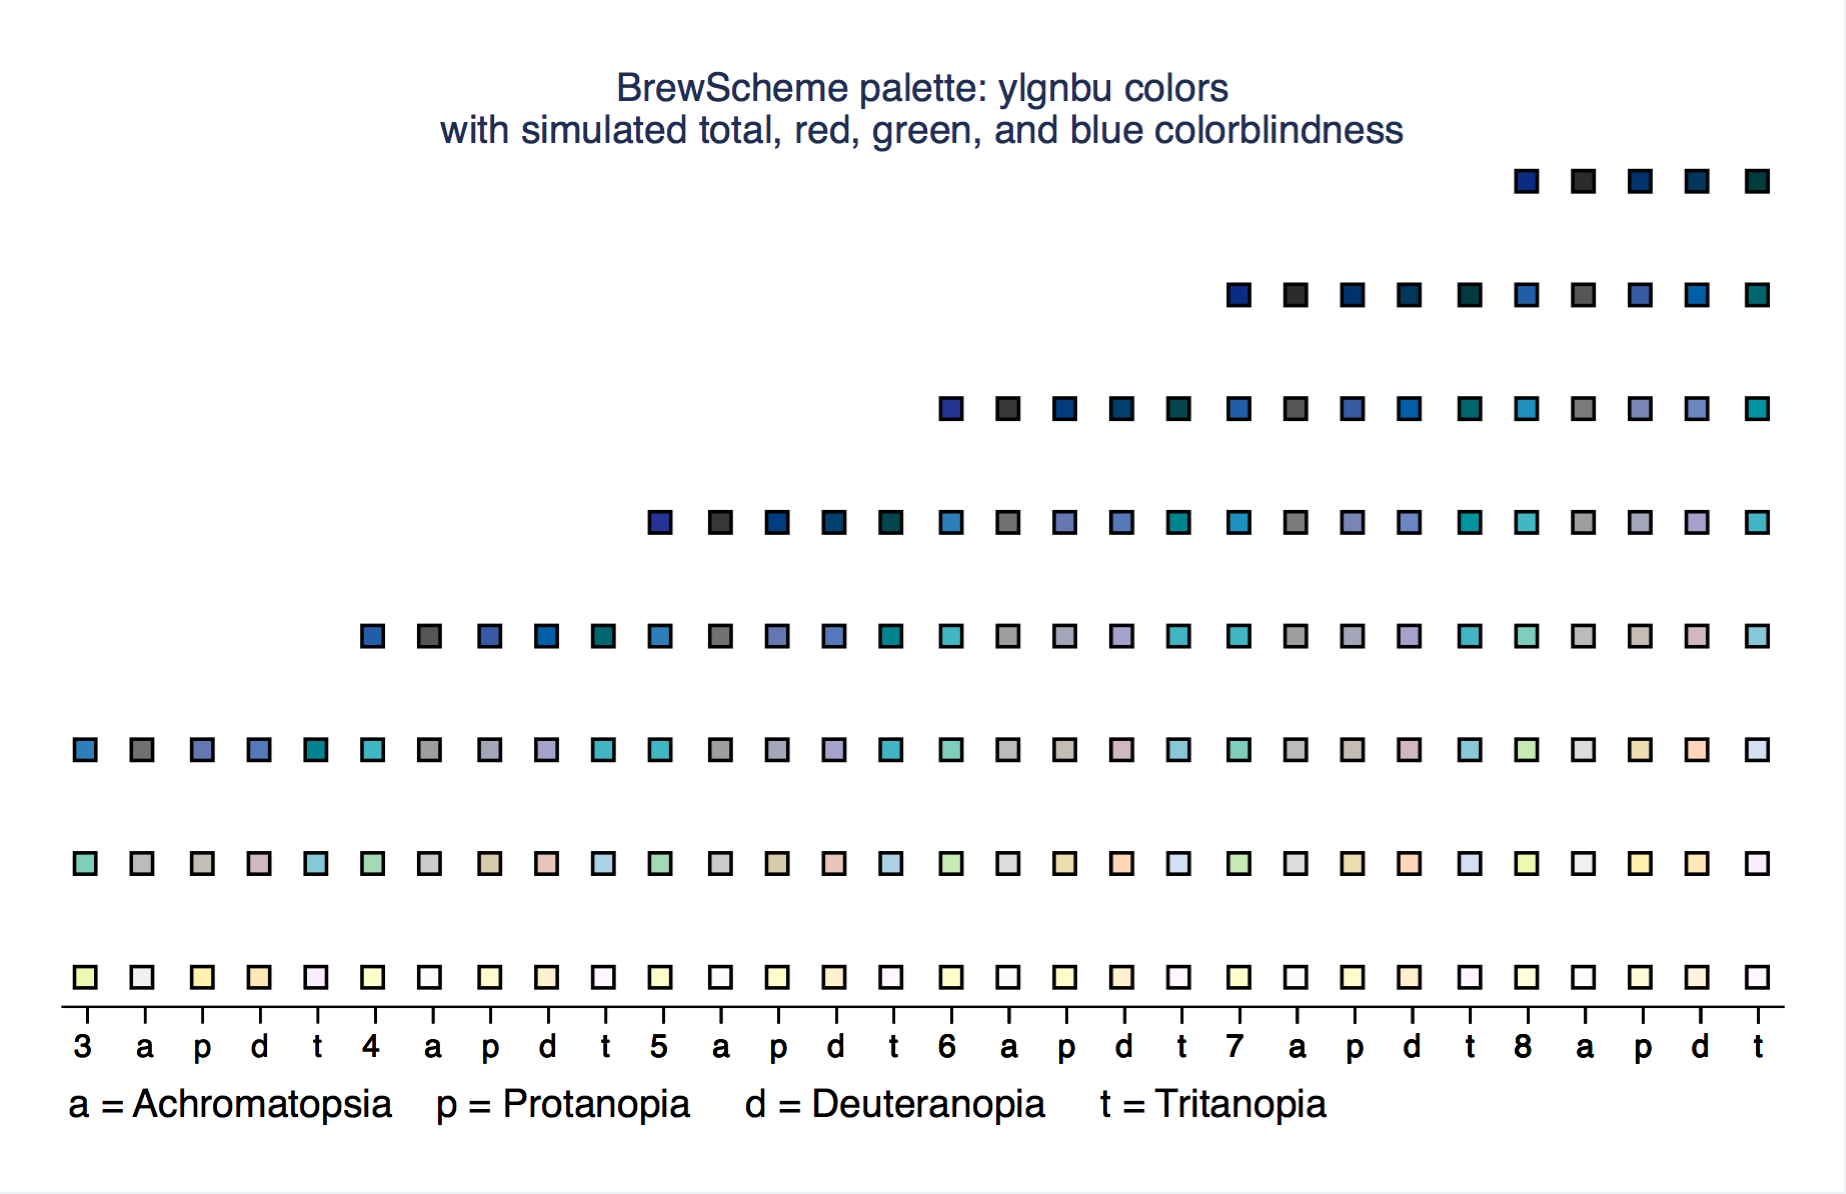 top of the gallery back to the top
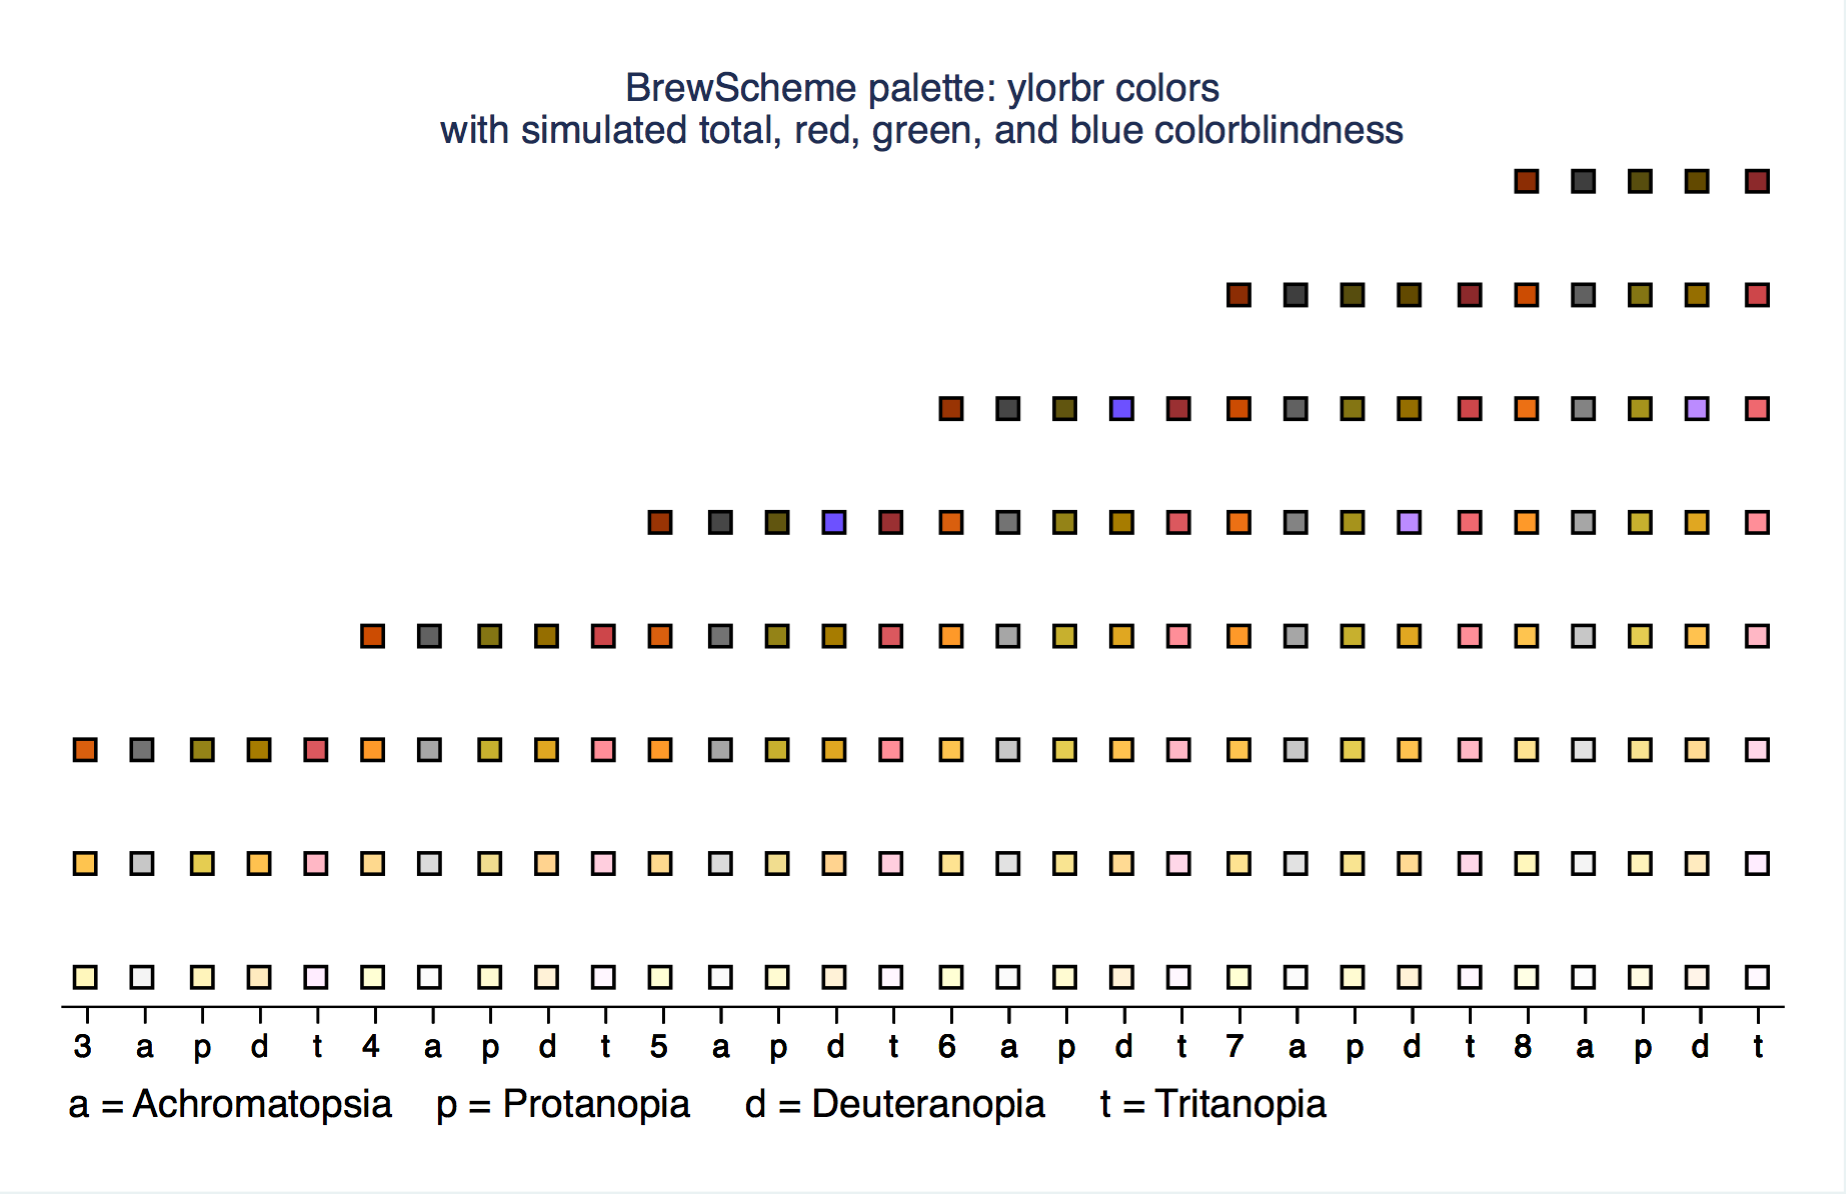
ylorbr
 top of the gallery back to the top
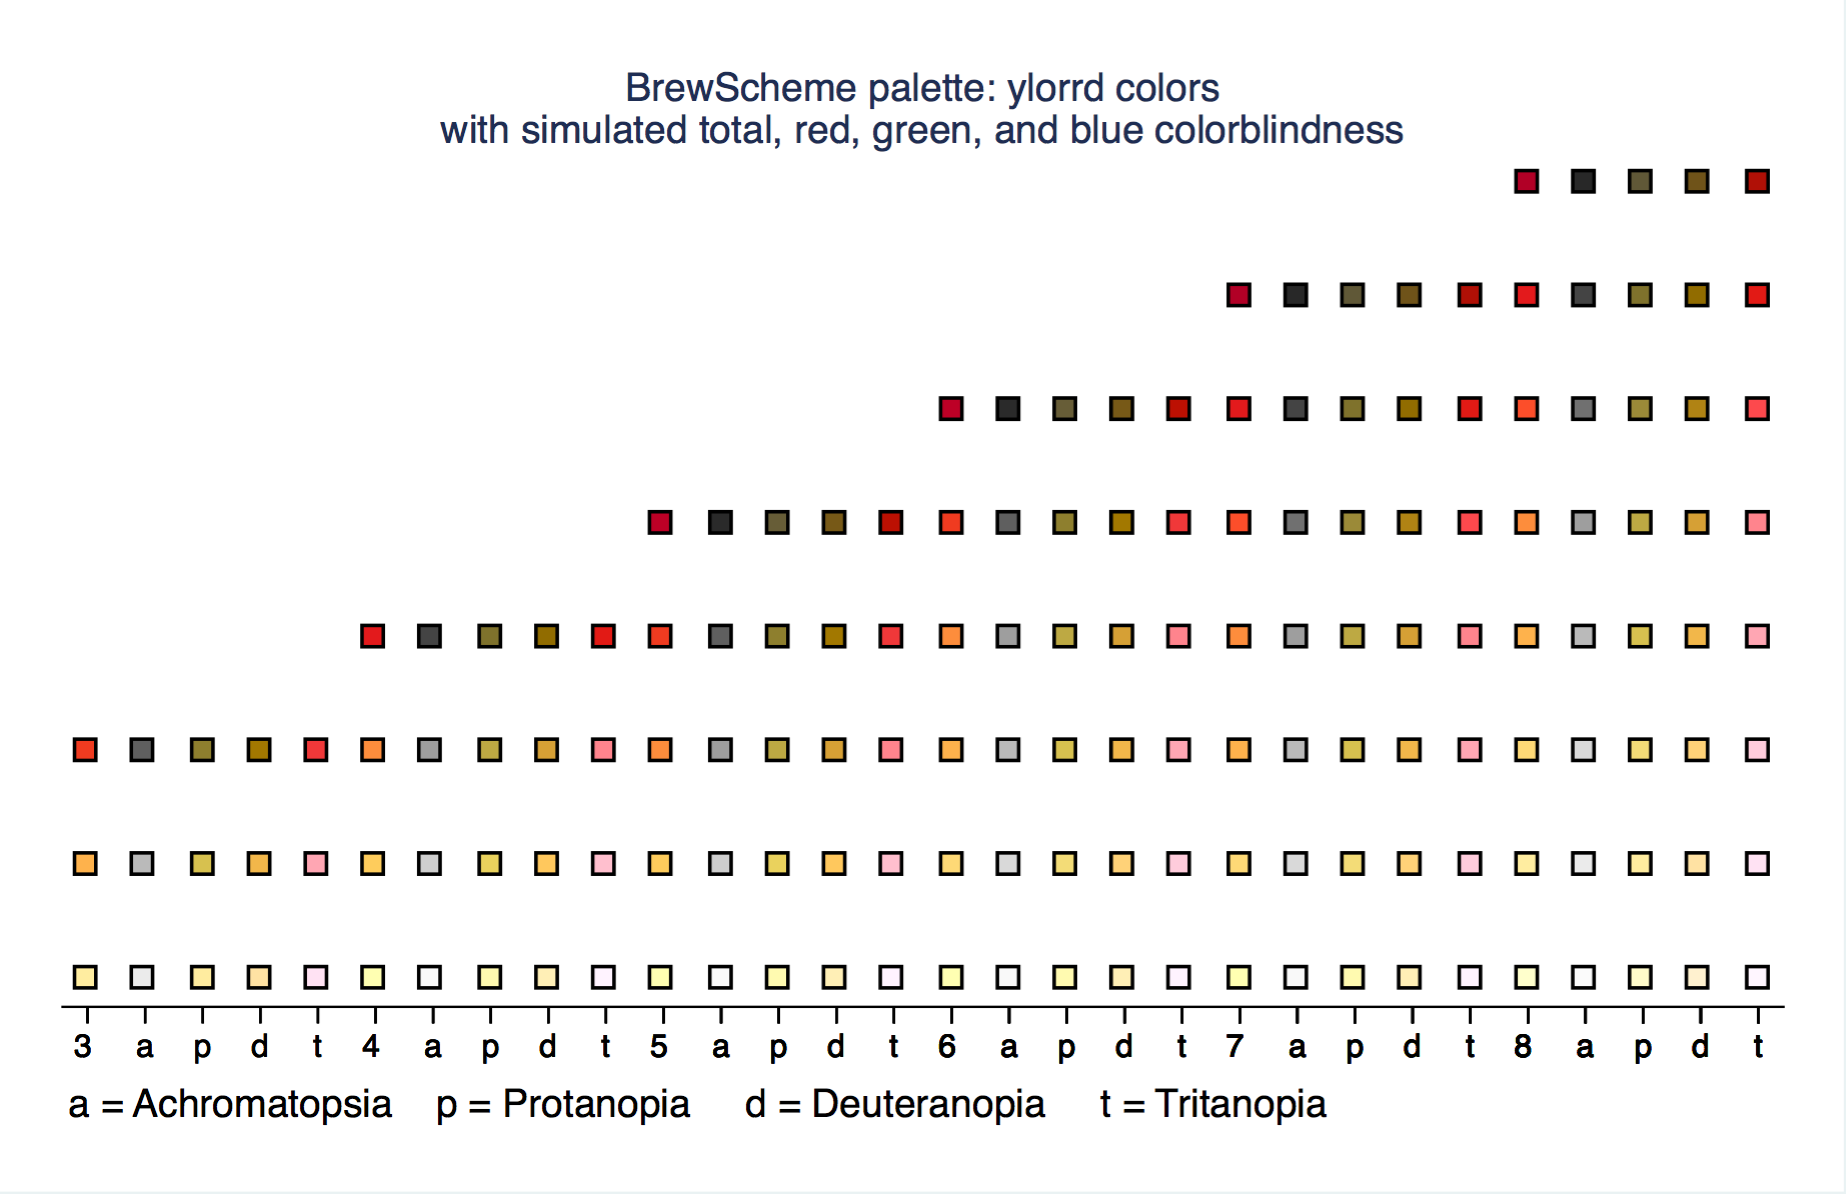
ylorrd
 top of the gallery back to the top
References
Wickline, M. (2014). Color.Vision.Simulate, Version 0.1. Retrieved from: http://galacticmilk.com/labs/Color-Vision/Javascript/Color.Vision.Simulate.js. Retrieved on: 24nov2015 back to the top