brewproof
Prefix command to create color sight impairment proofs of a graph.
brewproof – is a program to generate a proof copy of a graph to simulate how the image would be viewed by individuals with achromatopsia, protanopia, deuteranopia, and tritanopia.
Syntax
brewproof, scheme(brewscheme scheme file): graph command
Description
brewproof is used to simulate the appearance of the specified graph as seen if the viewer suffered from achromatopsia, protanopia, deuteranopia, or tritanopia. This is a prefix type command that wraps the user-specified graph file to generate separate simulated graphs as well as a proof copy with all four of the color impaired versions of the graph on a single image.
Examples
Ex 1.
Proof a graph with ggplot2 styled aesthetics.
// Load the auto data set
sysuse auto.dta, clear

// Proof the examples used in other help files
brewproof, scheme(ggtest2) : tw lowess mpg weight             ||     ///
                             scatter mpg weight if rep78 == 1 ||     ///
                             scatter mpg weight if rep78 == 2 ||     ///
                             scatter mpg weight if rep78 == 3 ||     ///
                             scatter mpg weight if rep78 == 4 ||     ///
                             scatter mpg weight if rep78 == 5,       ///
                             legend(order(2 "1978 Repair Record = 1" ///
                             3 "1978 Repair Record = 2"              ///
                             4 "1978 Repair Record = 3"              ///
                             5 "1978 Repair Record = 4"              ///
                             6 "1978 Repair Record = 5"))
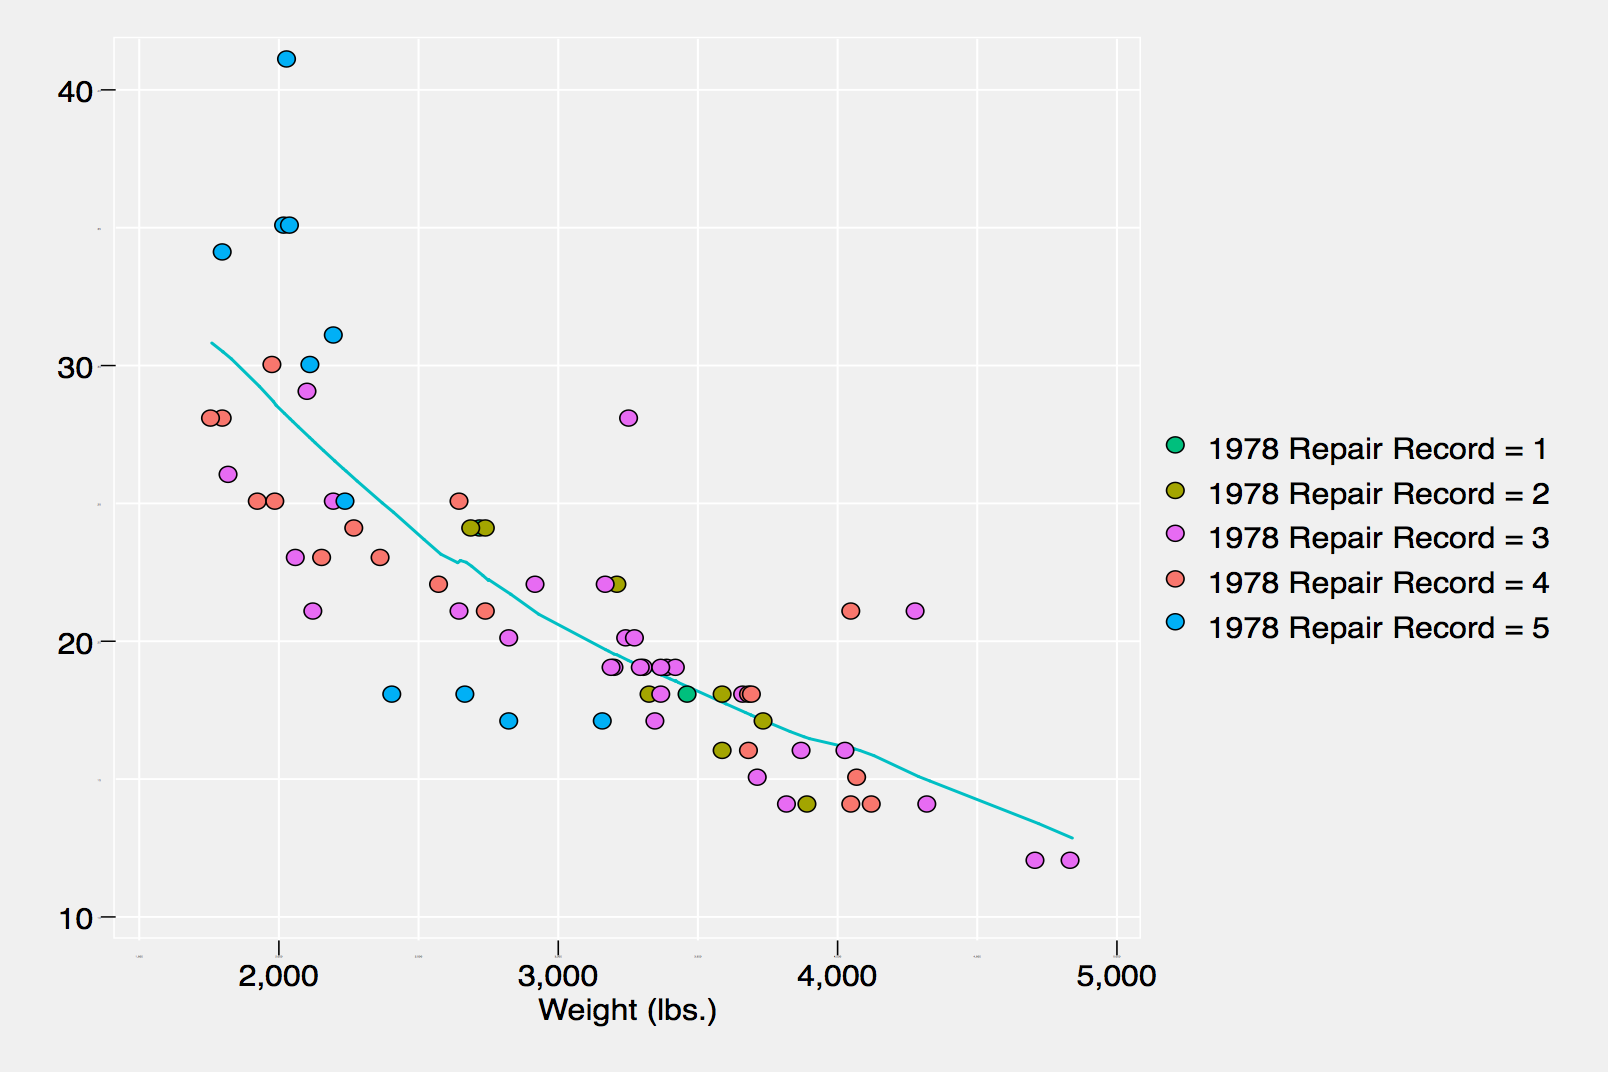 The baseline/original graph specified by the user (this is the same graph illustrated on the brewtheme page.).
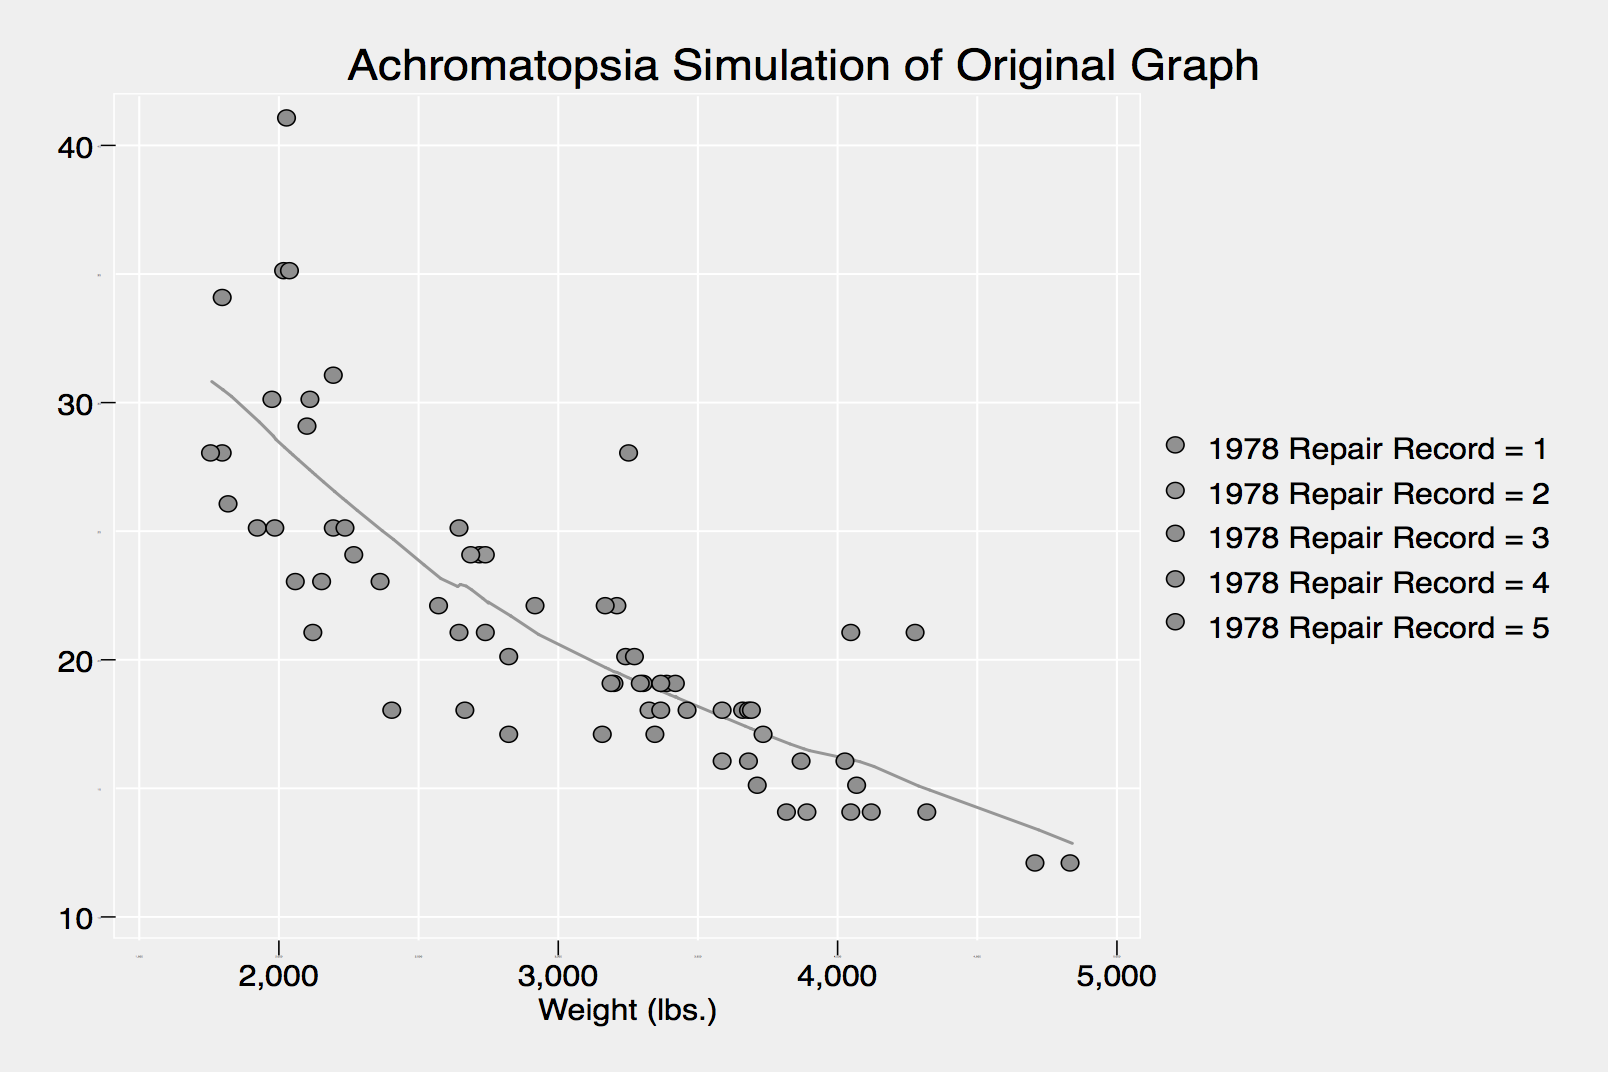 Achromatopsia simulated appearance.
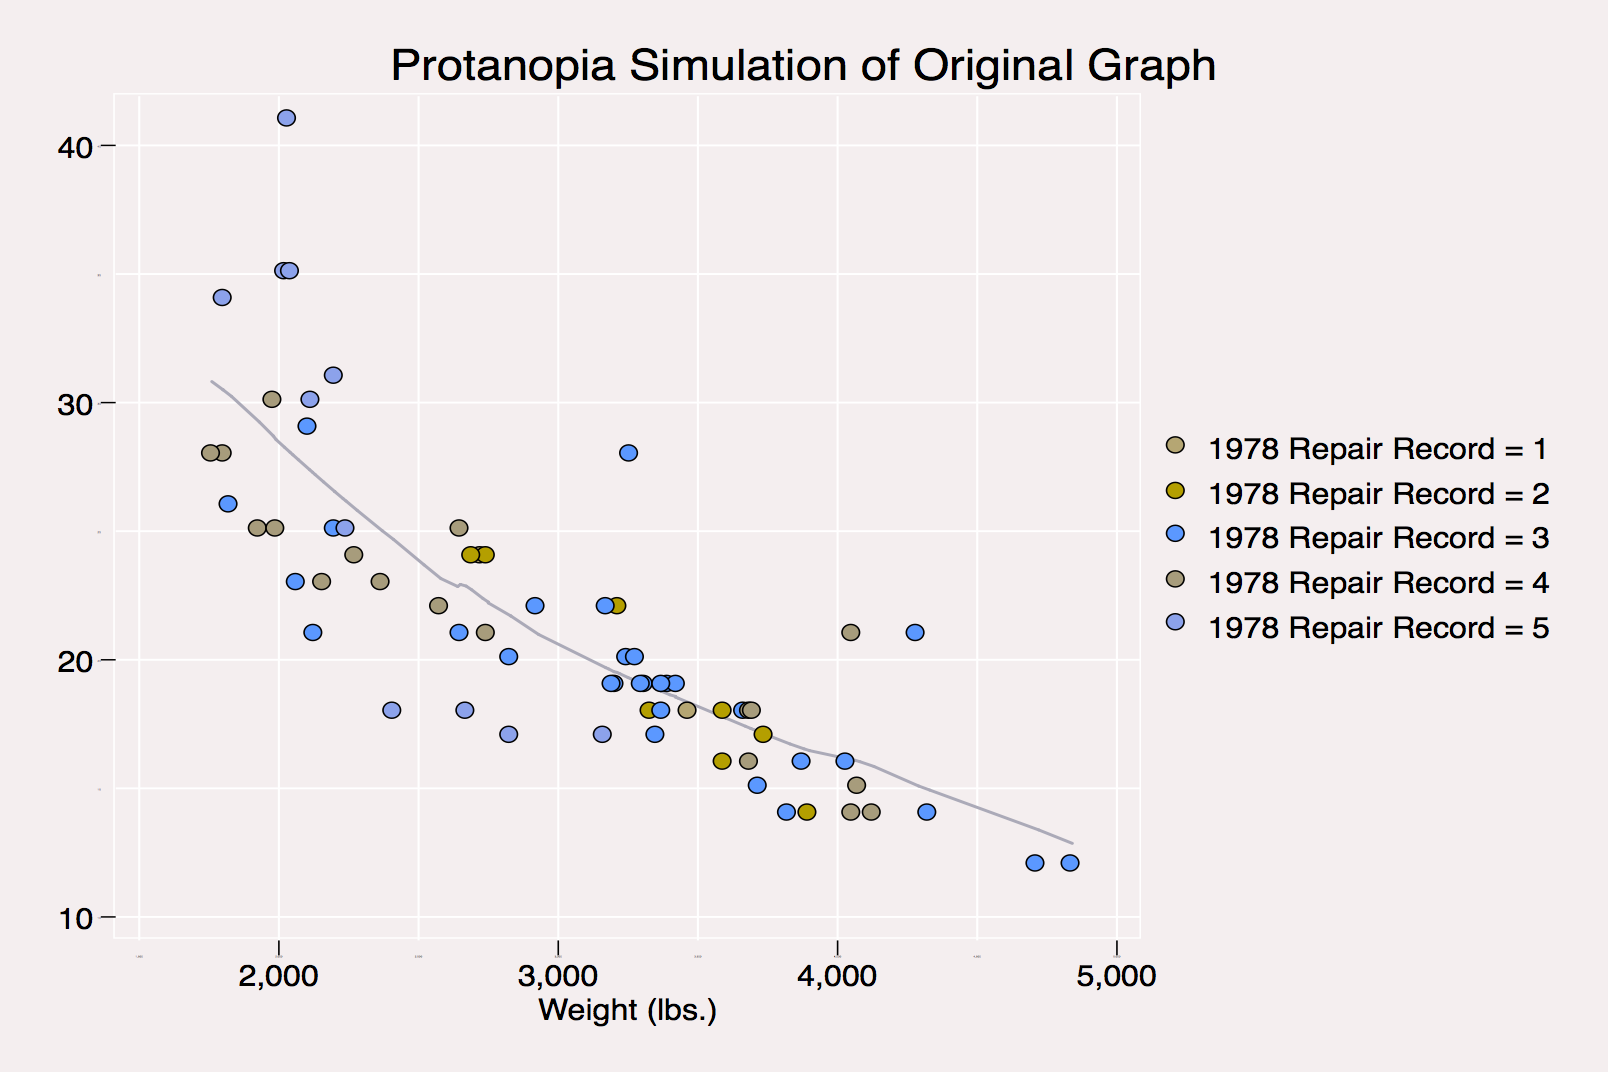 Protanopia simulated appearance.
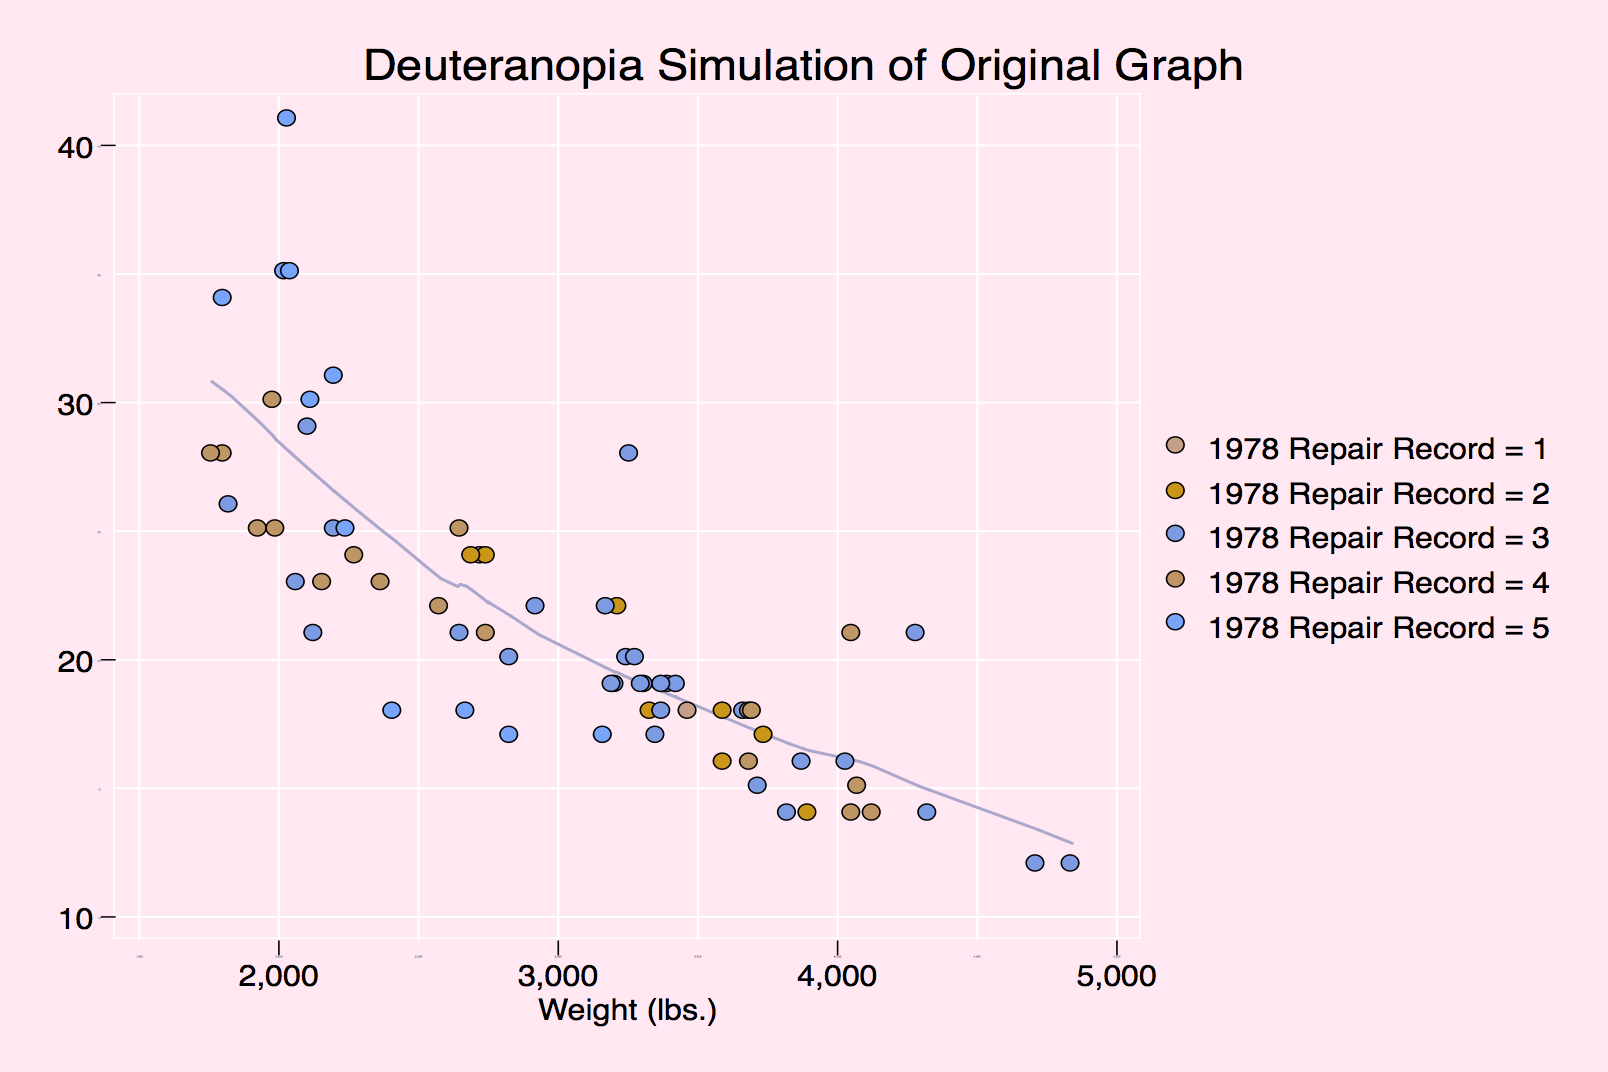 Deuteranopia simulated appearance.
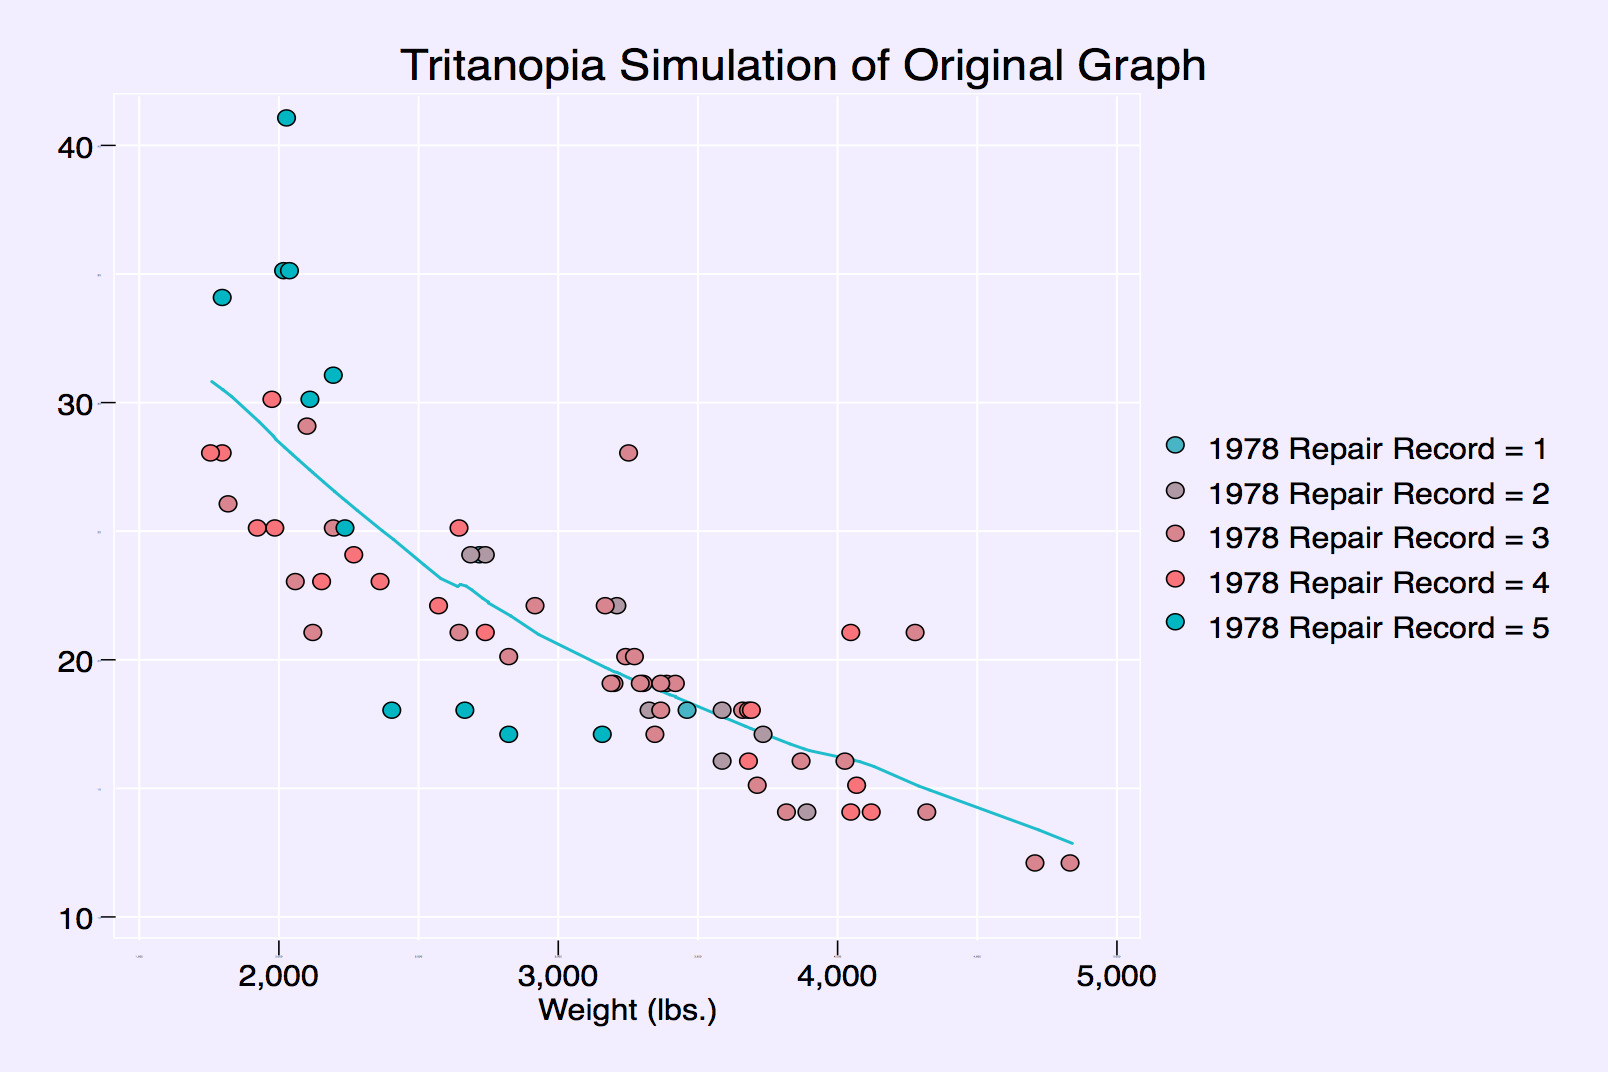 Tritanopia simulated appearance.
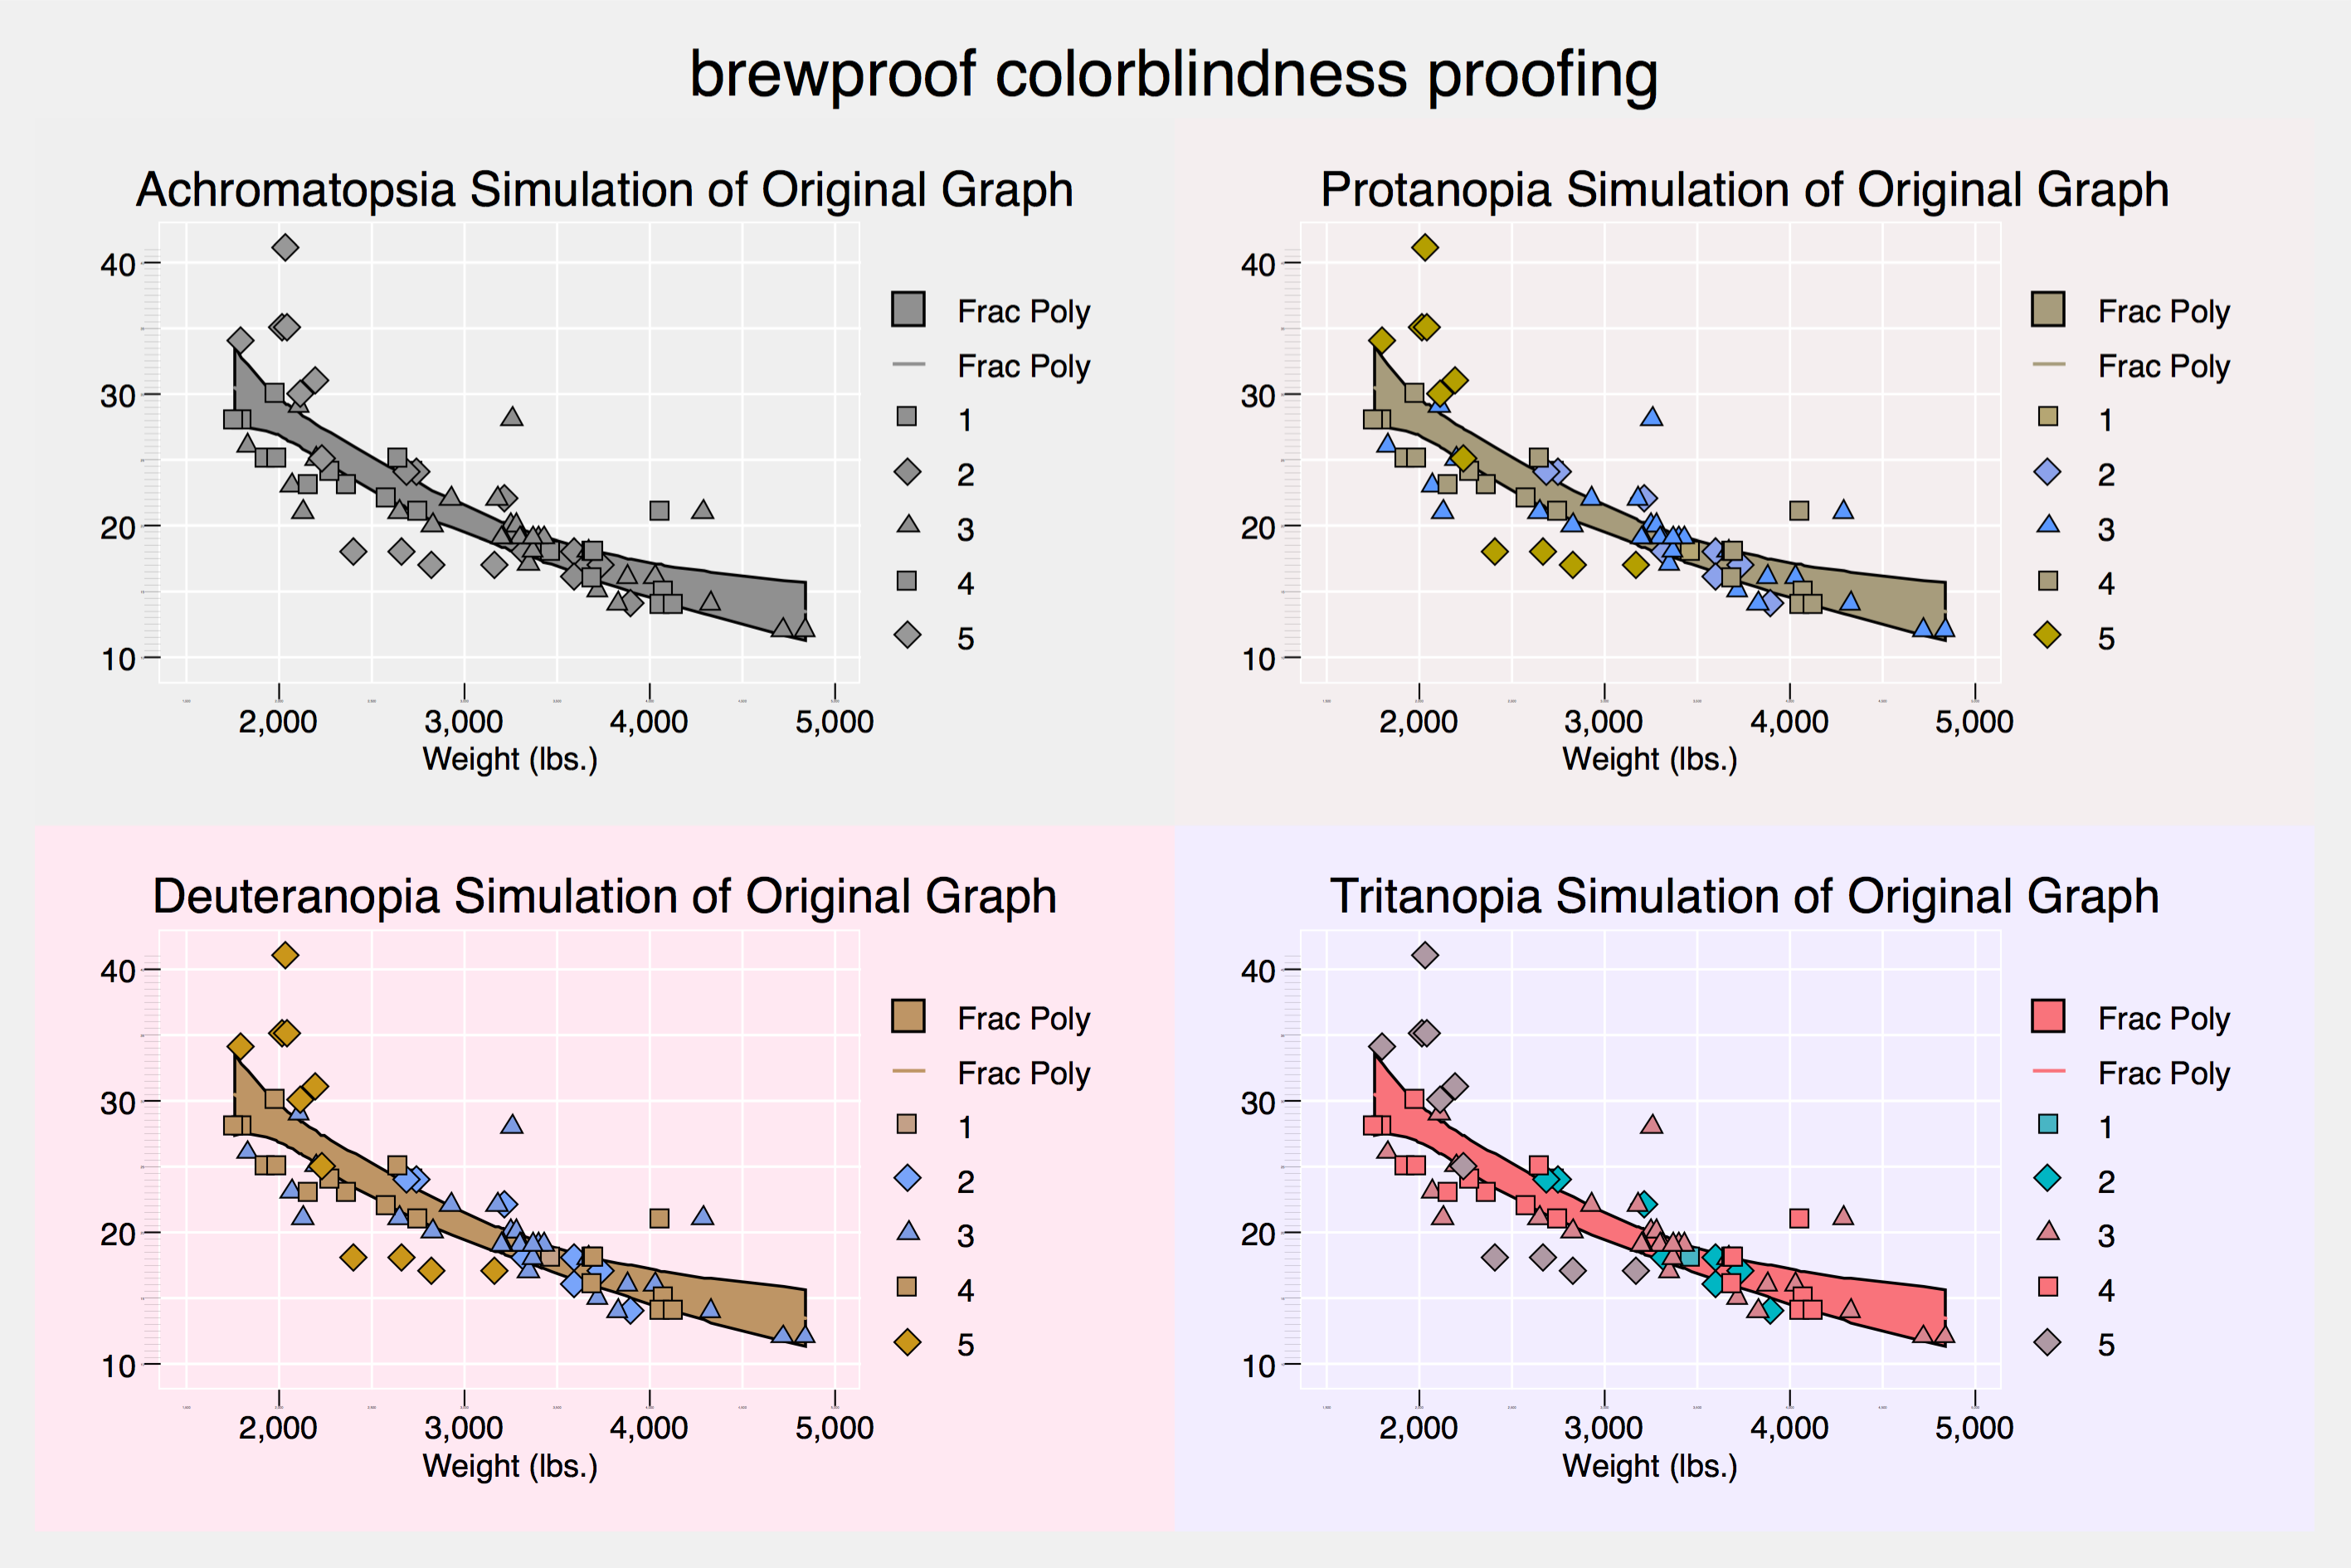
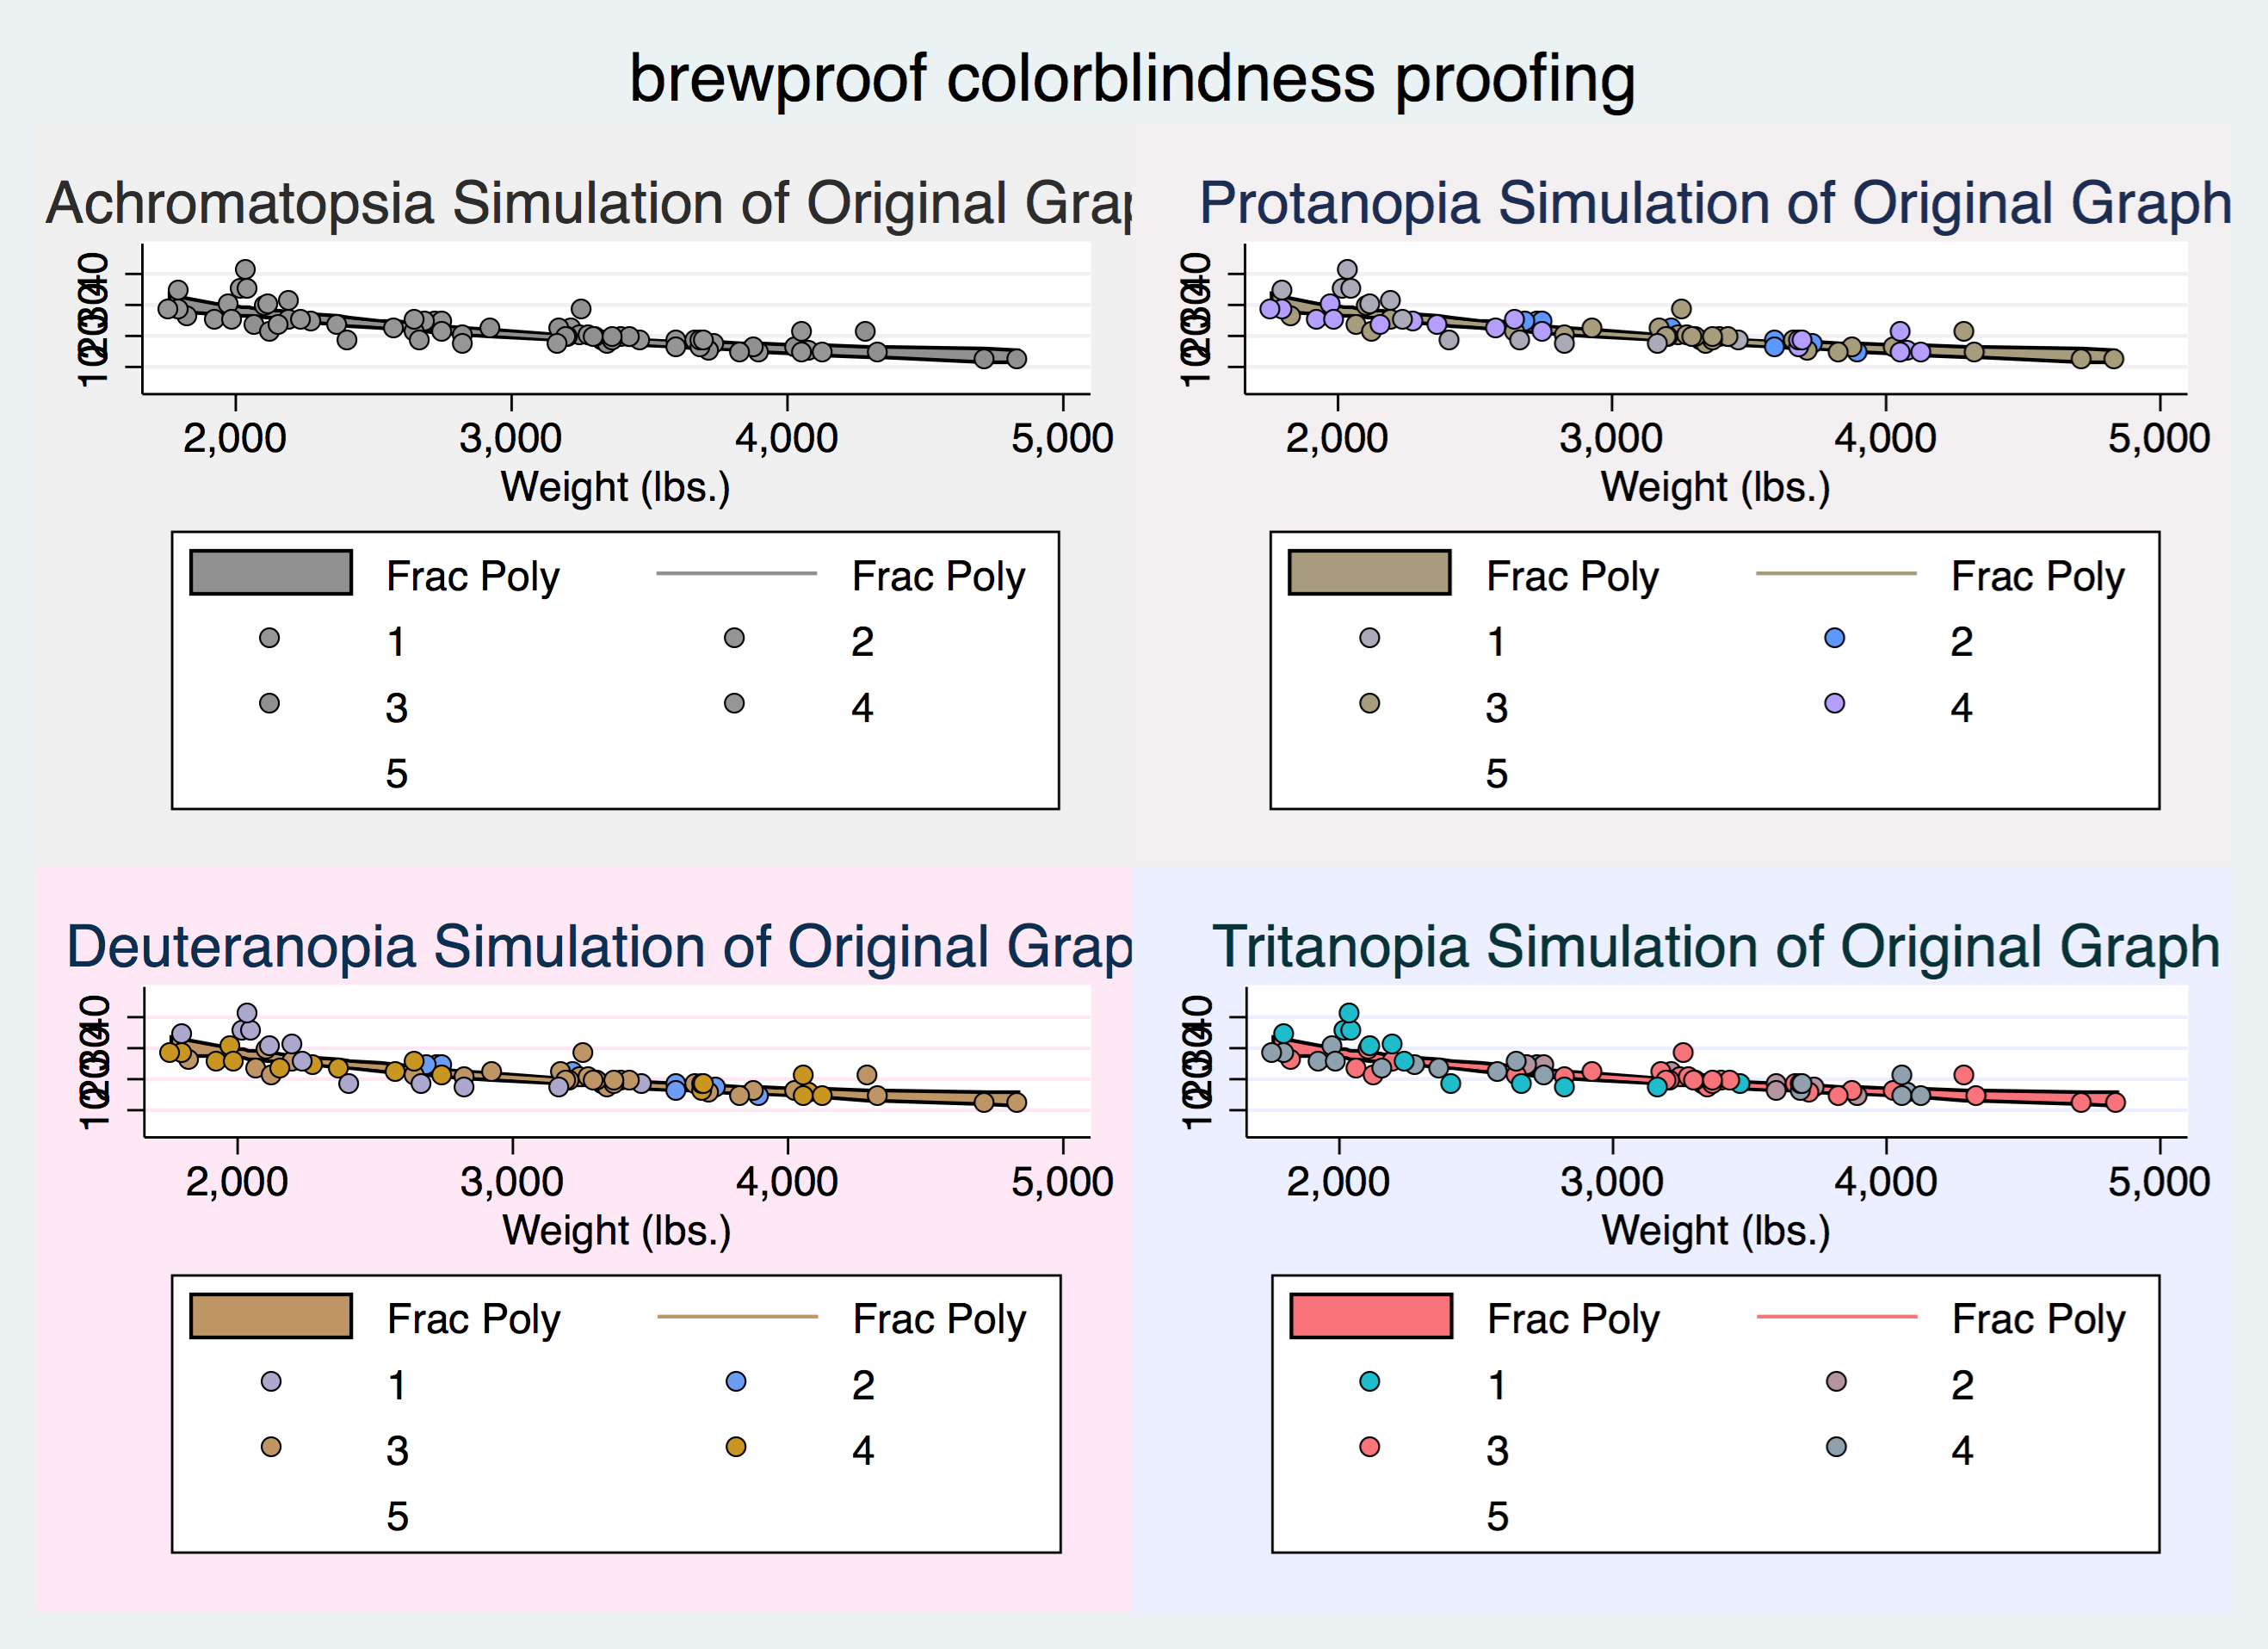
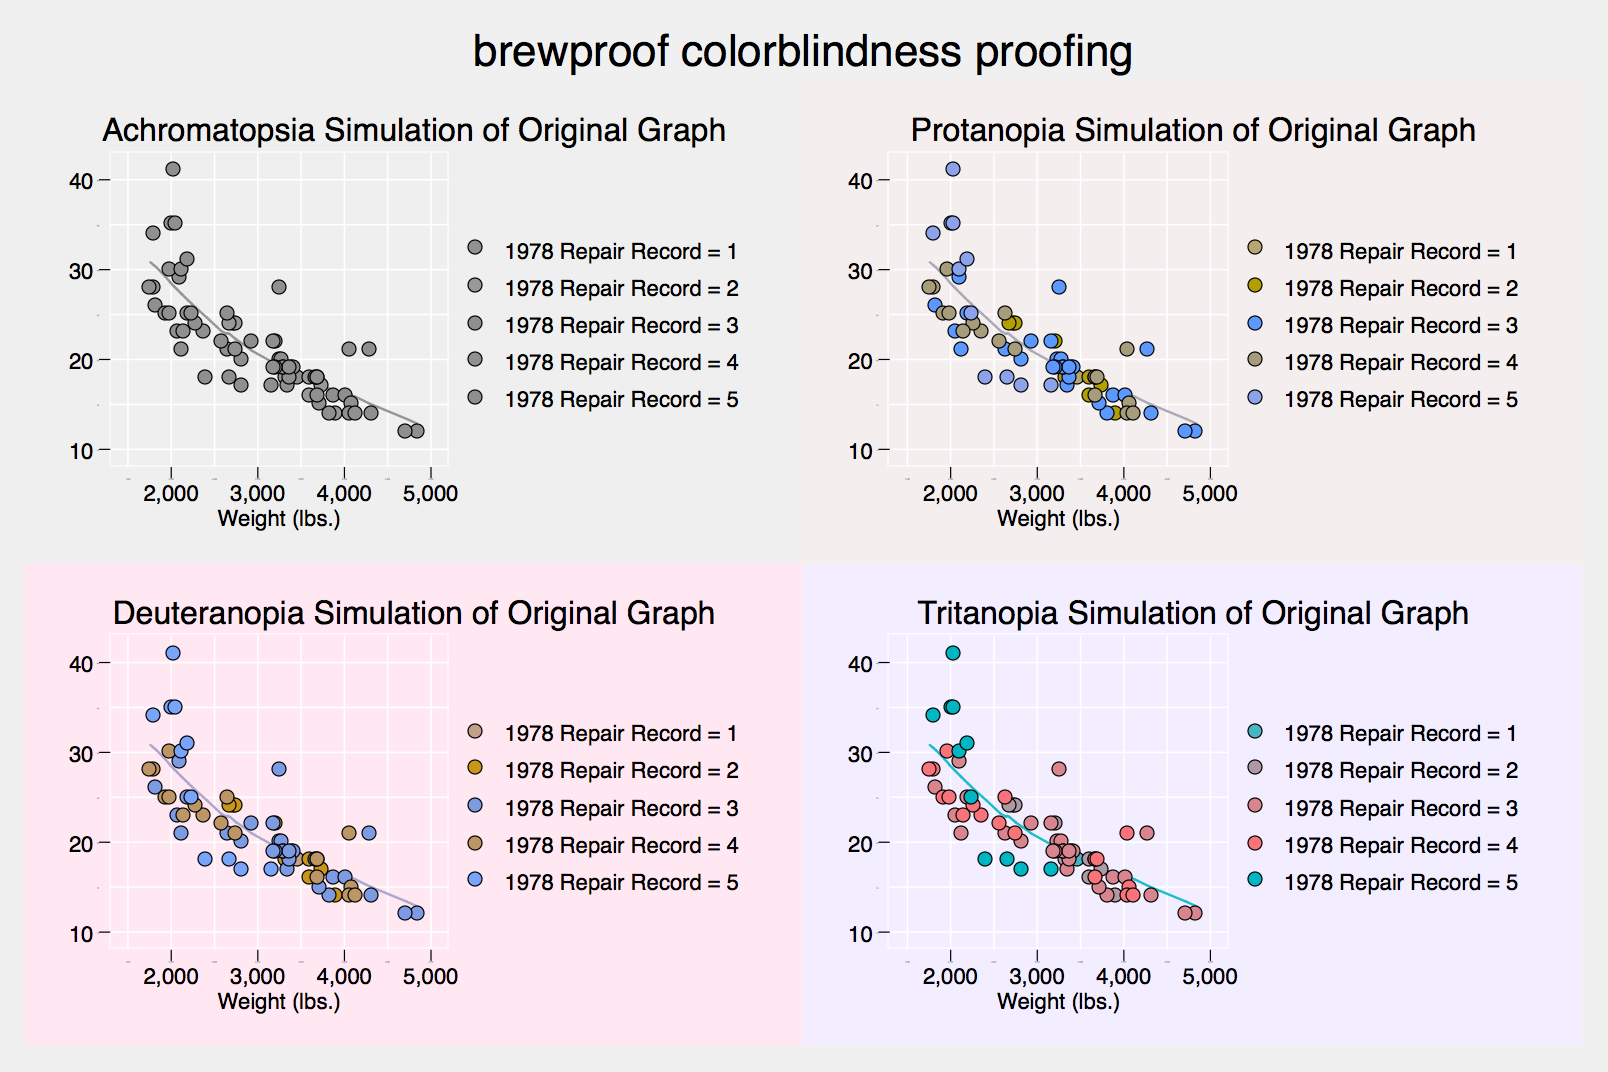 The proof graph with all four forms of colorblind simulated appearances in a single image.
Ex 2.
Examples from SJ Article
// Load the auto.dta dataset
sysuse auto.dta, clear

// Loop over the schemes
foreach scheme in onecolorex1 onecolorex2 ggplot2ex1          ///
somecolorex1 manycolorex1 ggplot2ex2 {

    // Create the same graph with each of the different schemes
    brewproof, scheme(`scheme') : tw fpfitci mpg weight ||    ///
        scatter mpg weight if rep78 == 1 ||                   ///
        scatter mpg weight if rep78 == 2 ||                   ///
        scatter mpg weight if rep78 == 3 ||                   ///
        scatter mpg weight if rep78 == 4 ||                   ///
        scatter mpg weight if rep78 == 5,                     ///
        legend(order(1 "Frac Poly" 2 "Frac Poly" 3 "1" 4 "2"  ///
        5 "3" 6 "4" 7 "5")) name(`scheme', replace)

} // End of Loop over scheme files
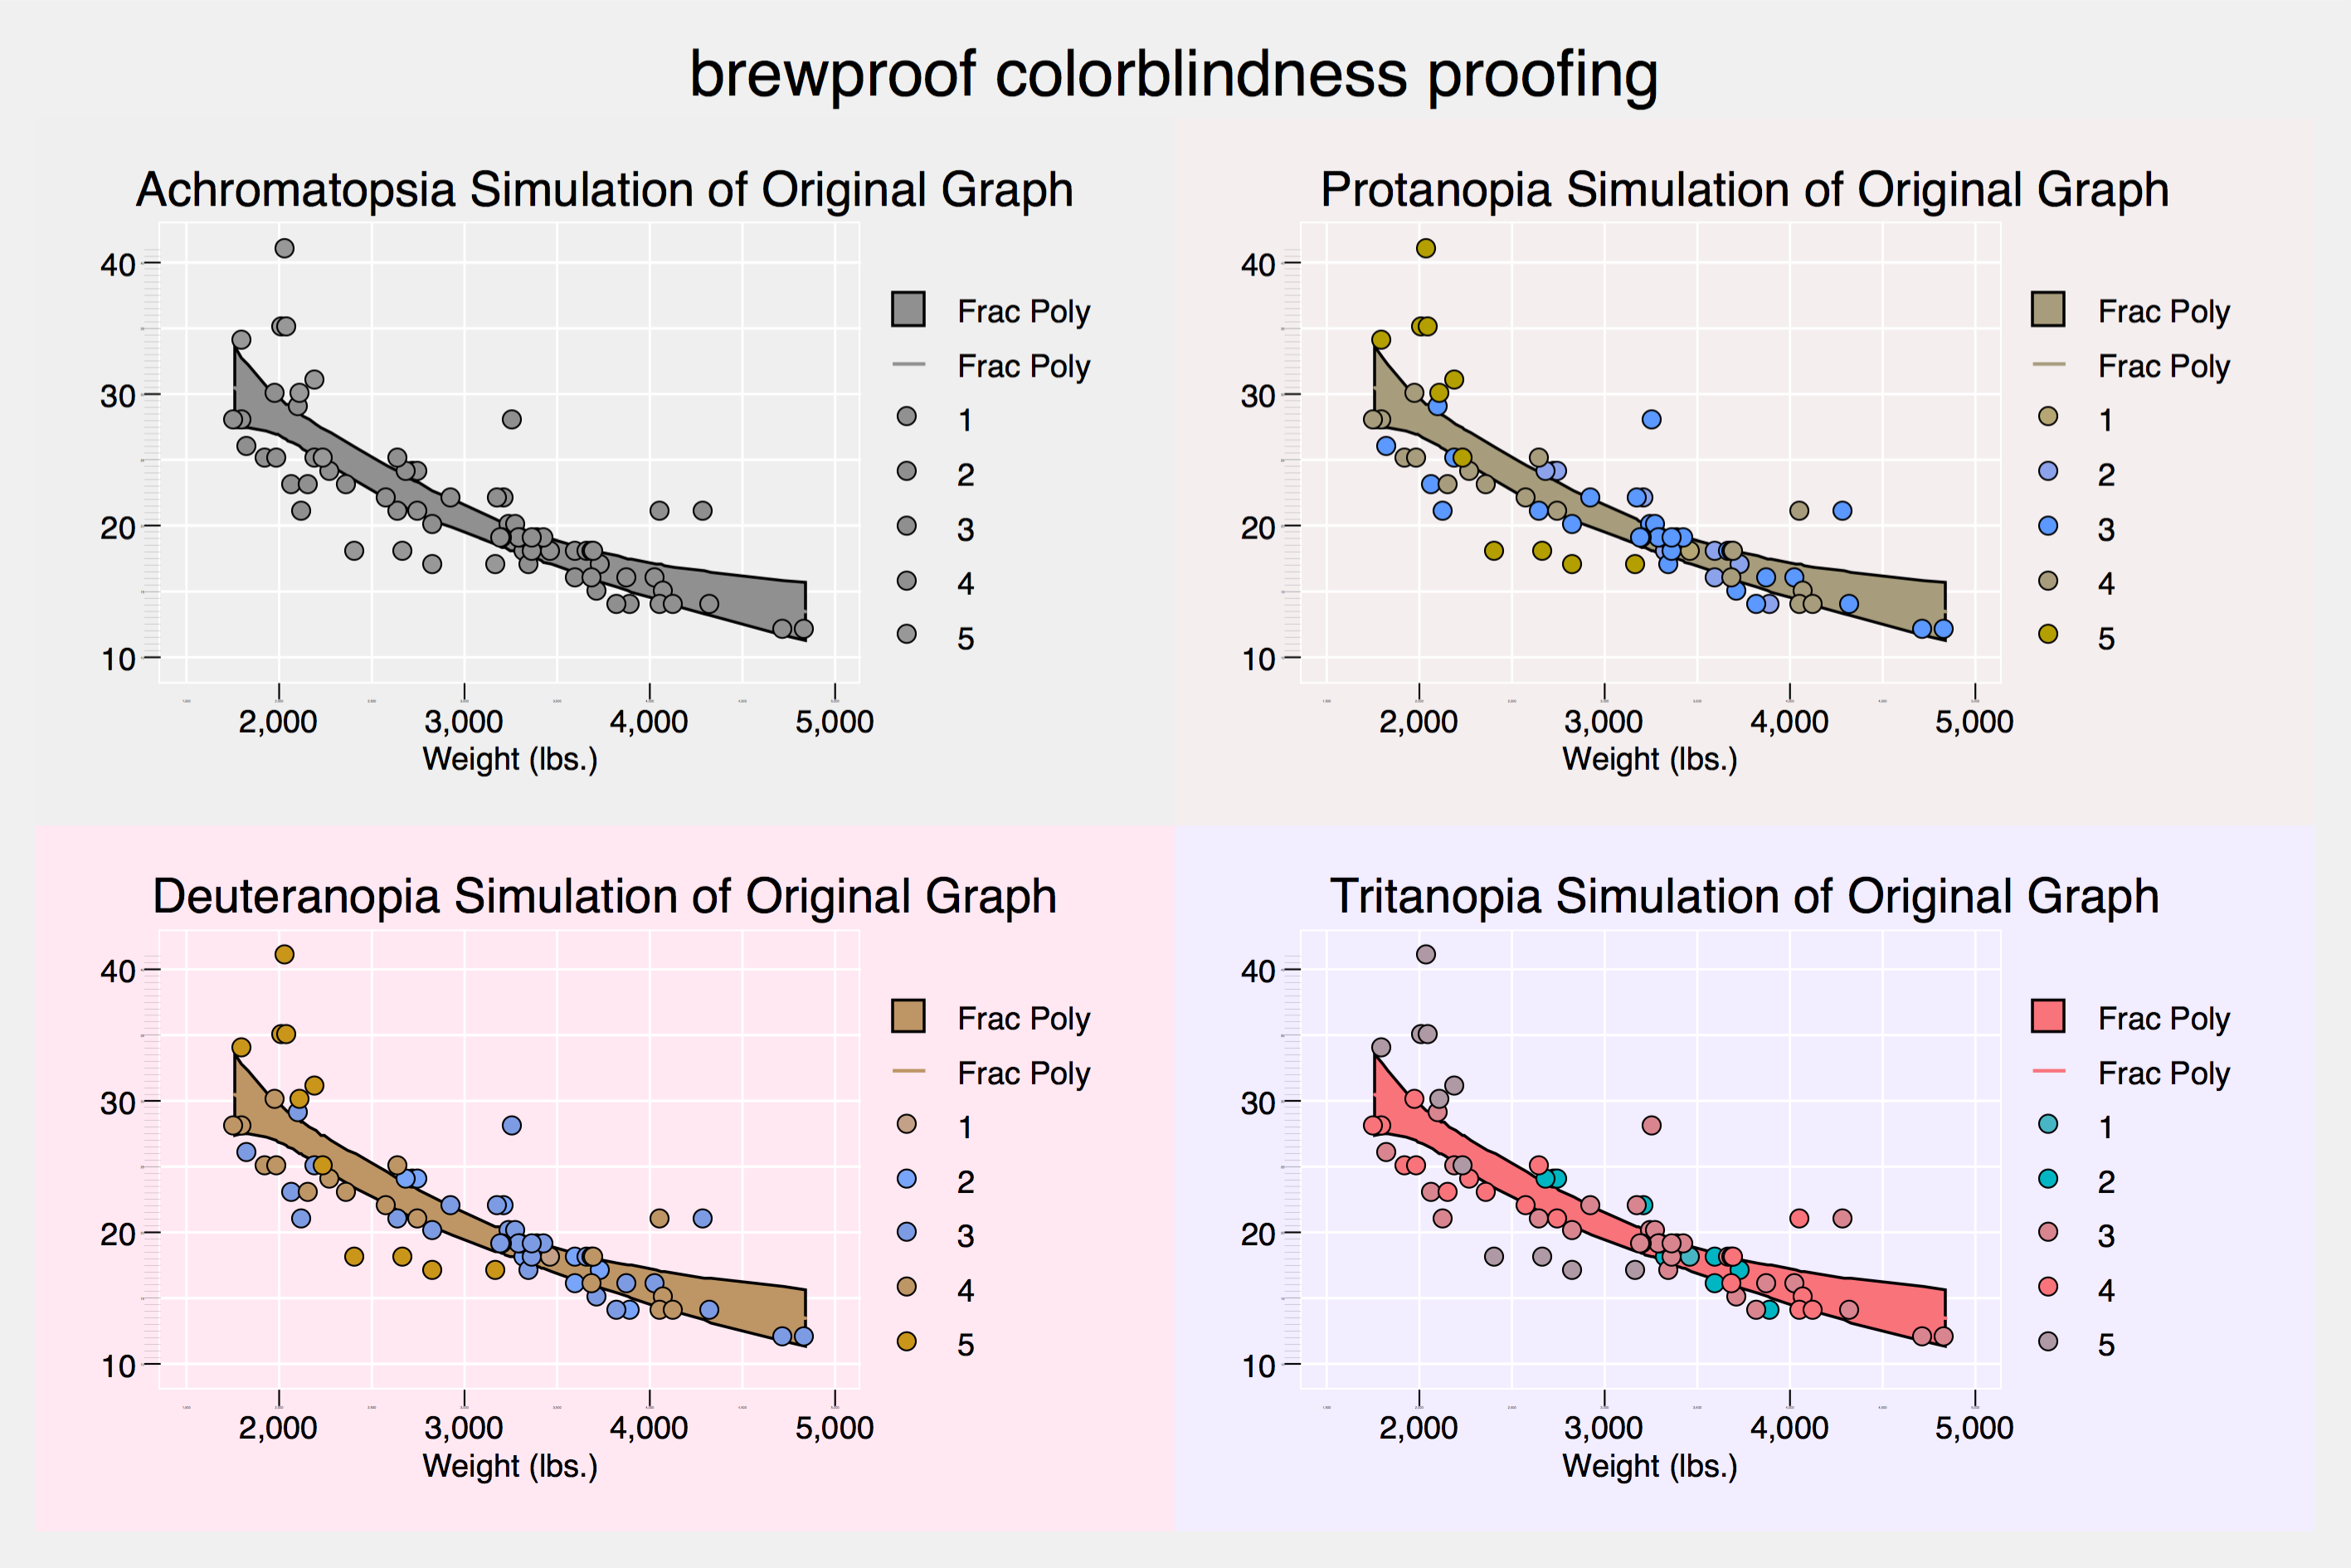
Example based on the onecolorex1 scheme:
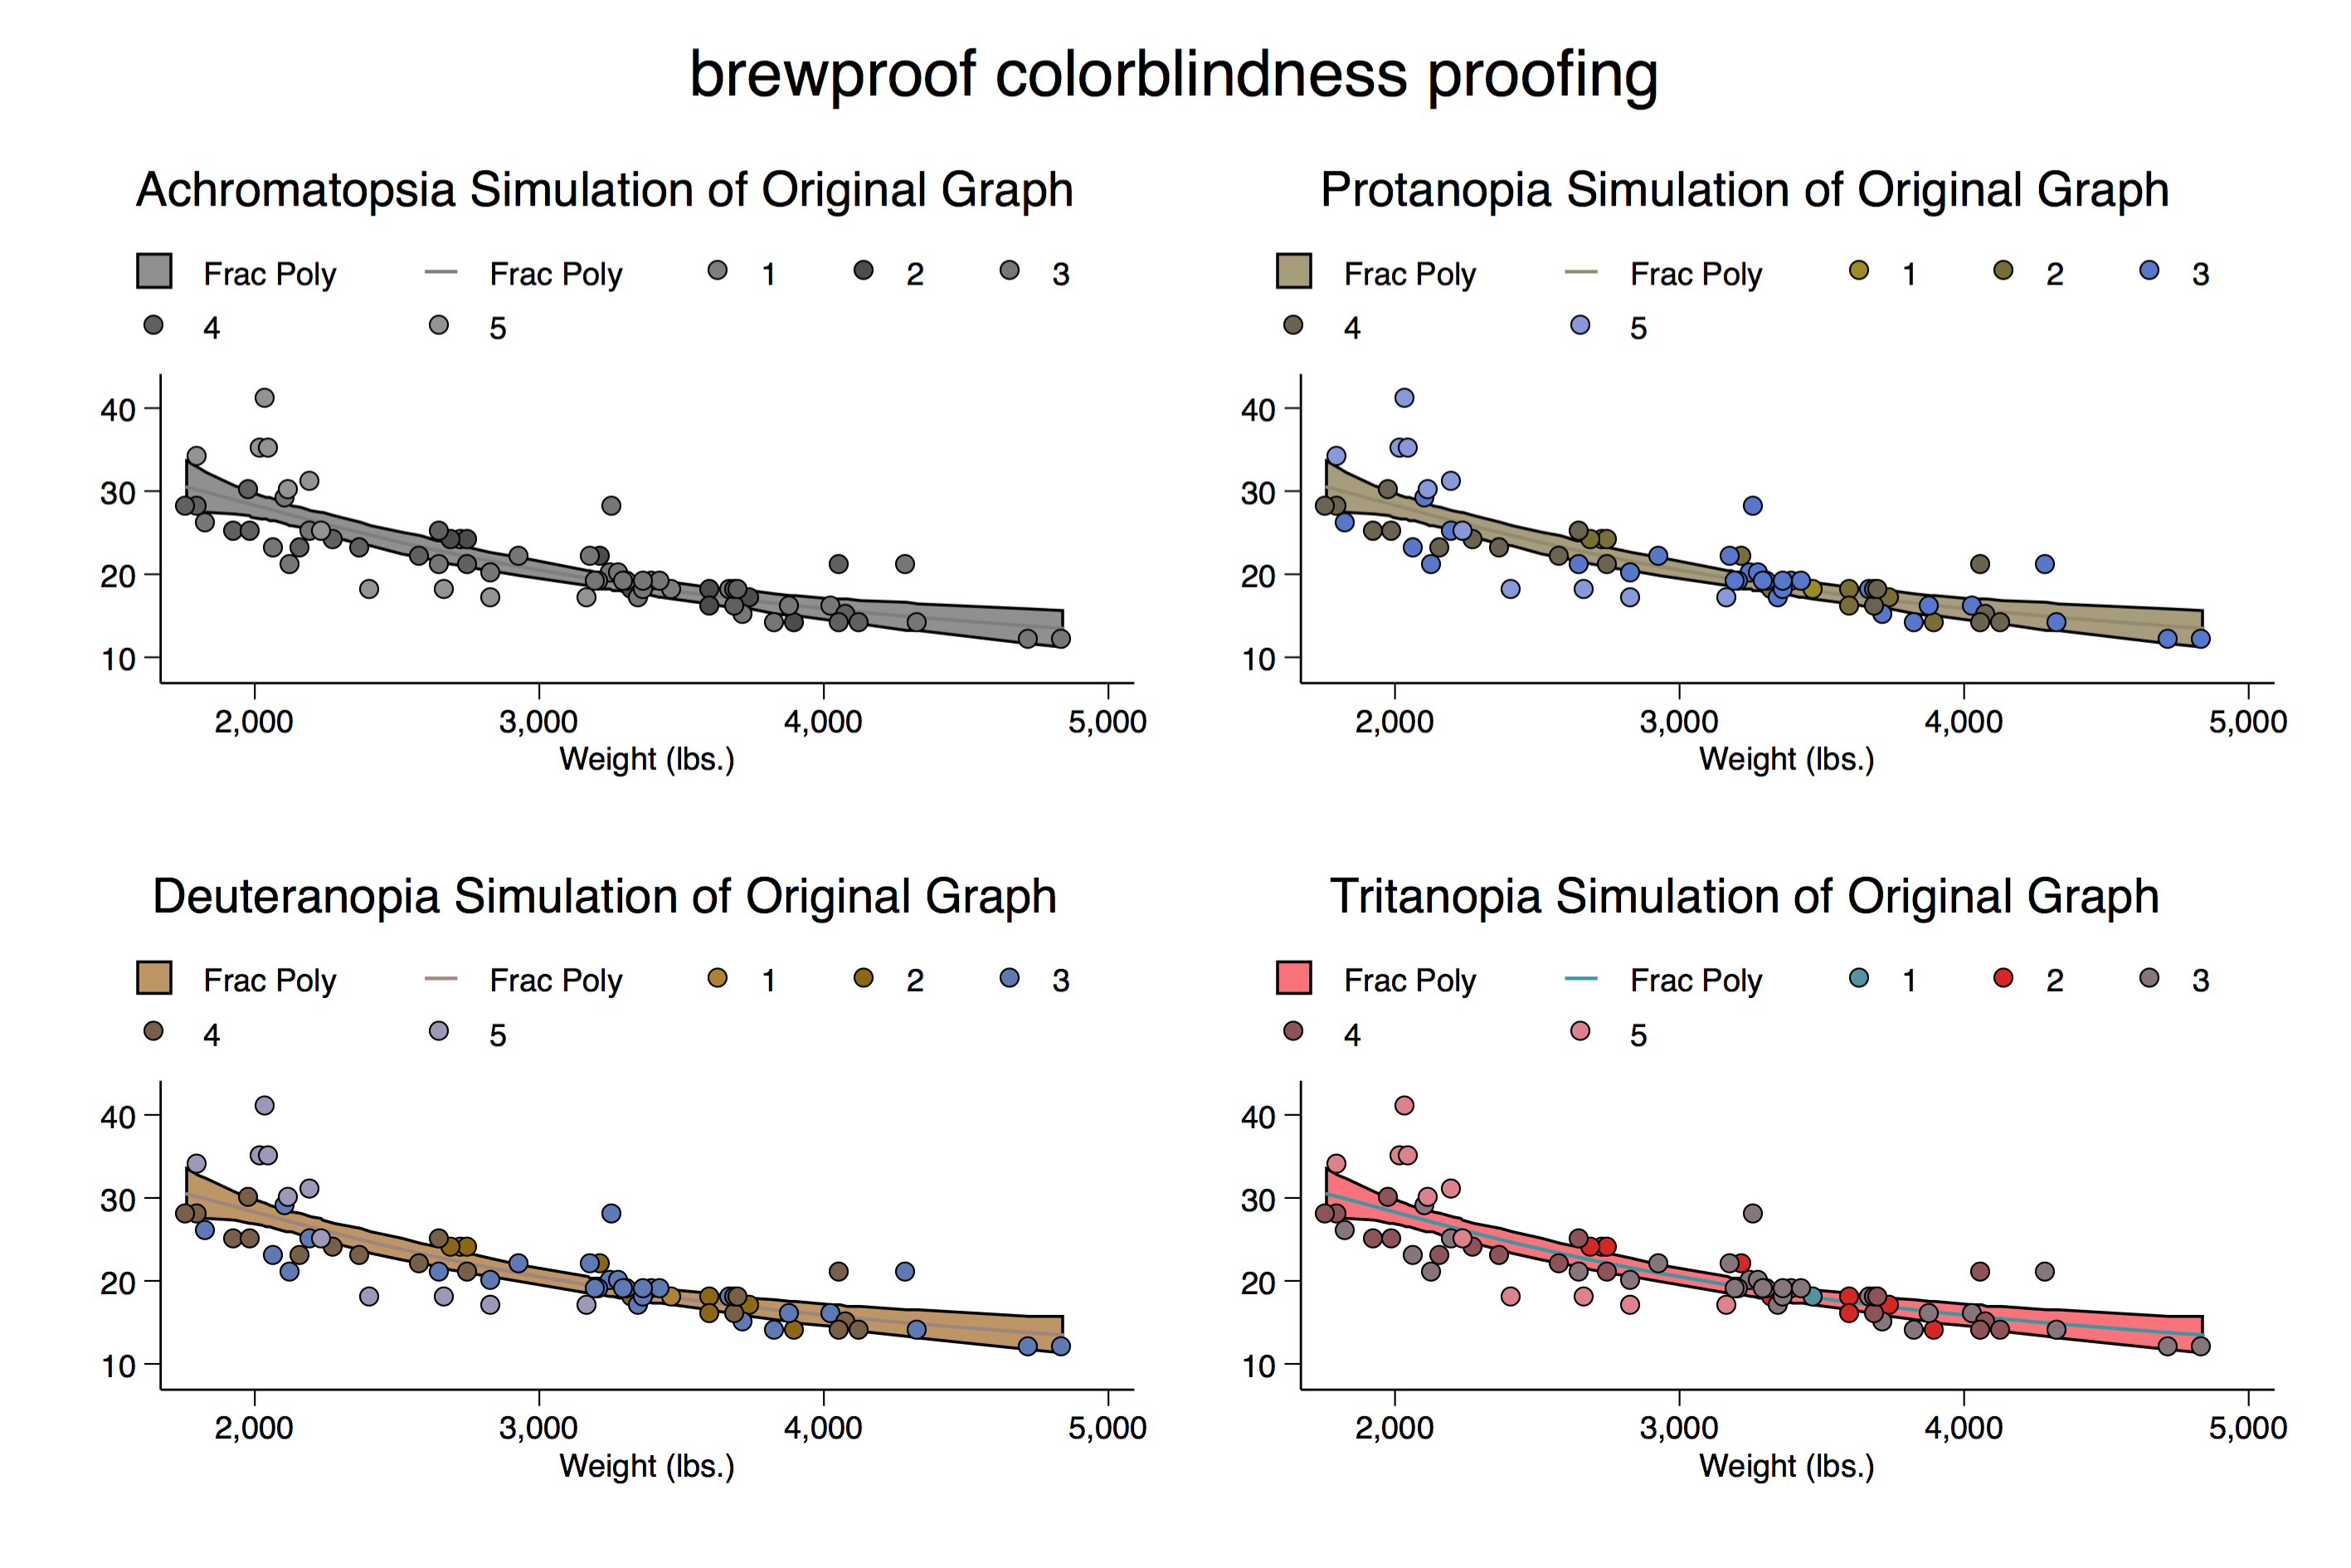
Example based on the onecolorex2 scheme:
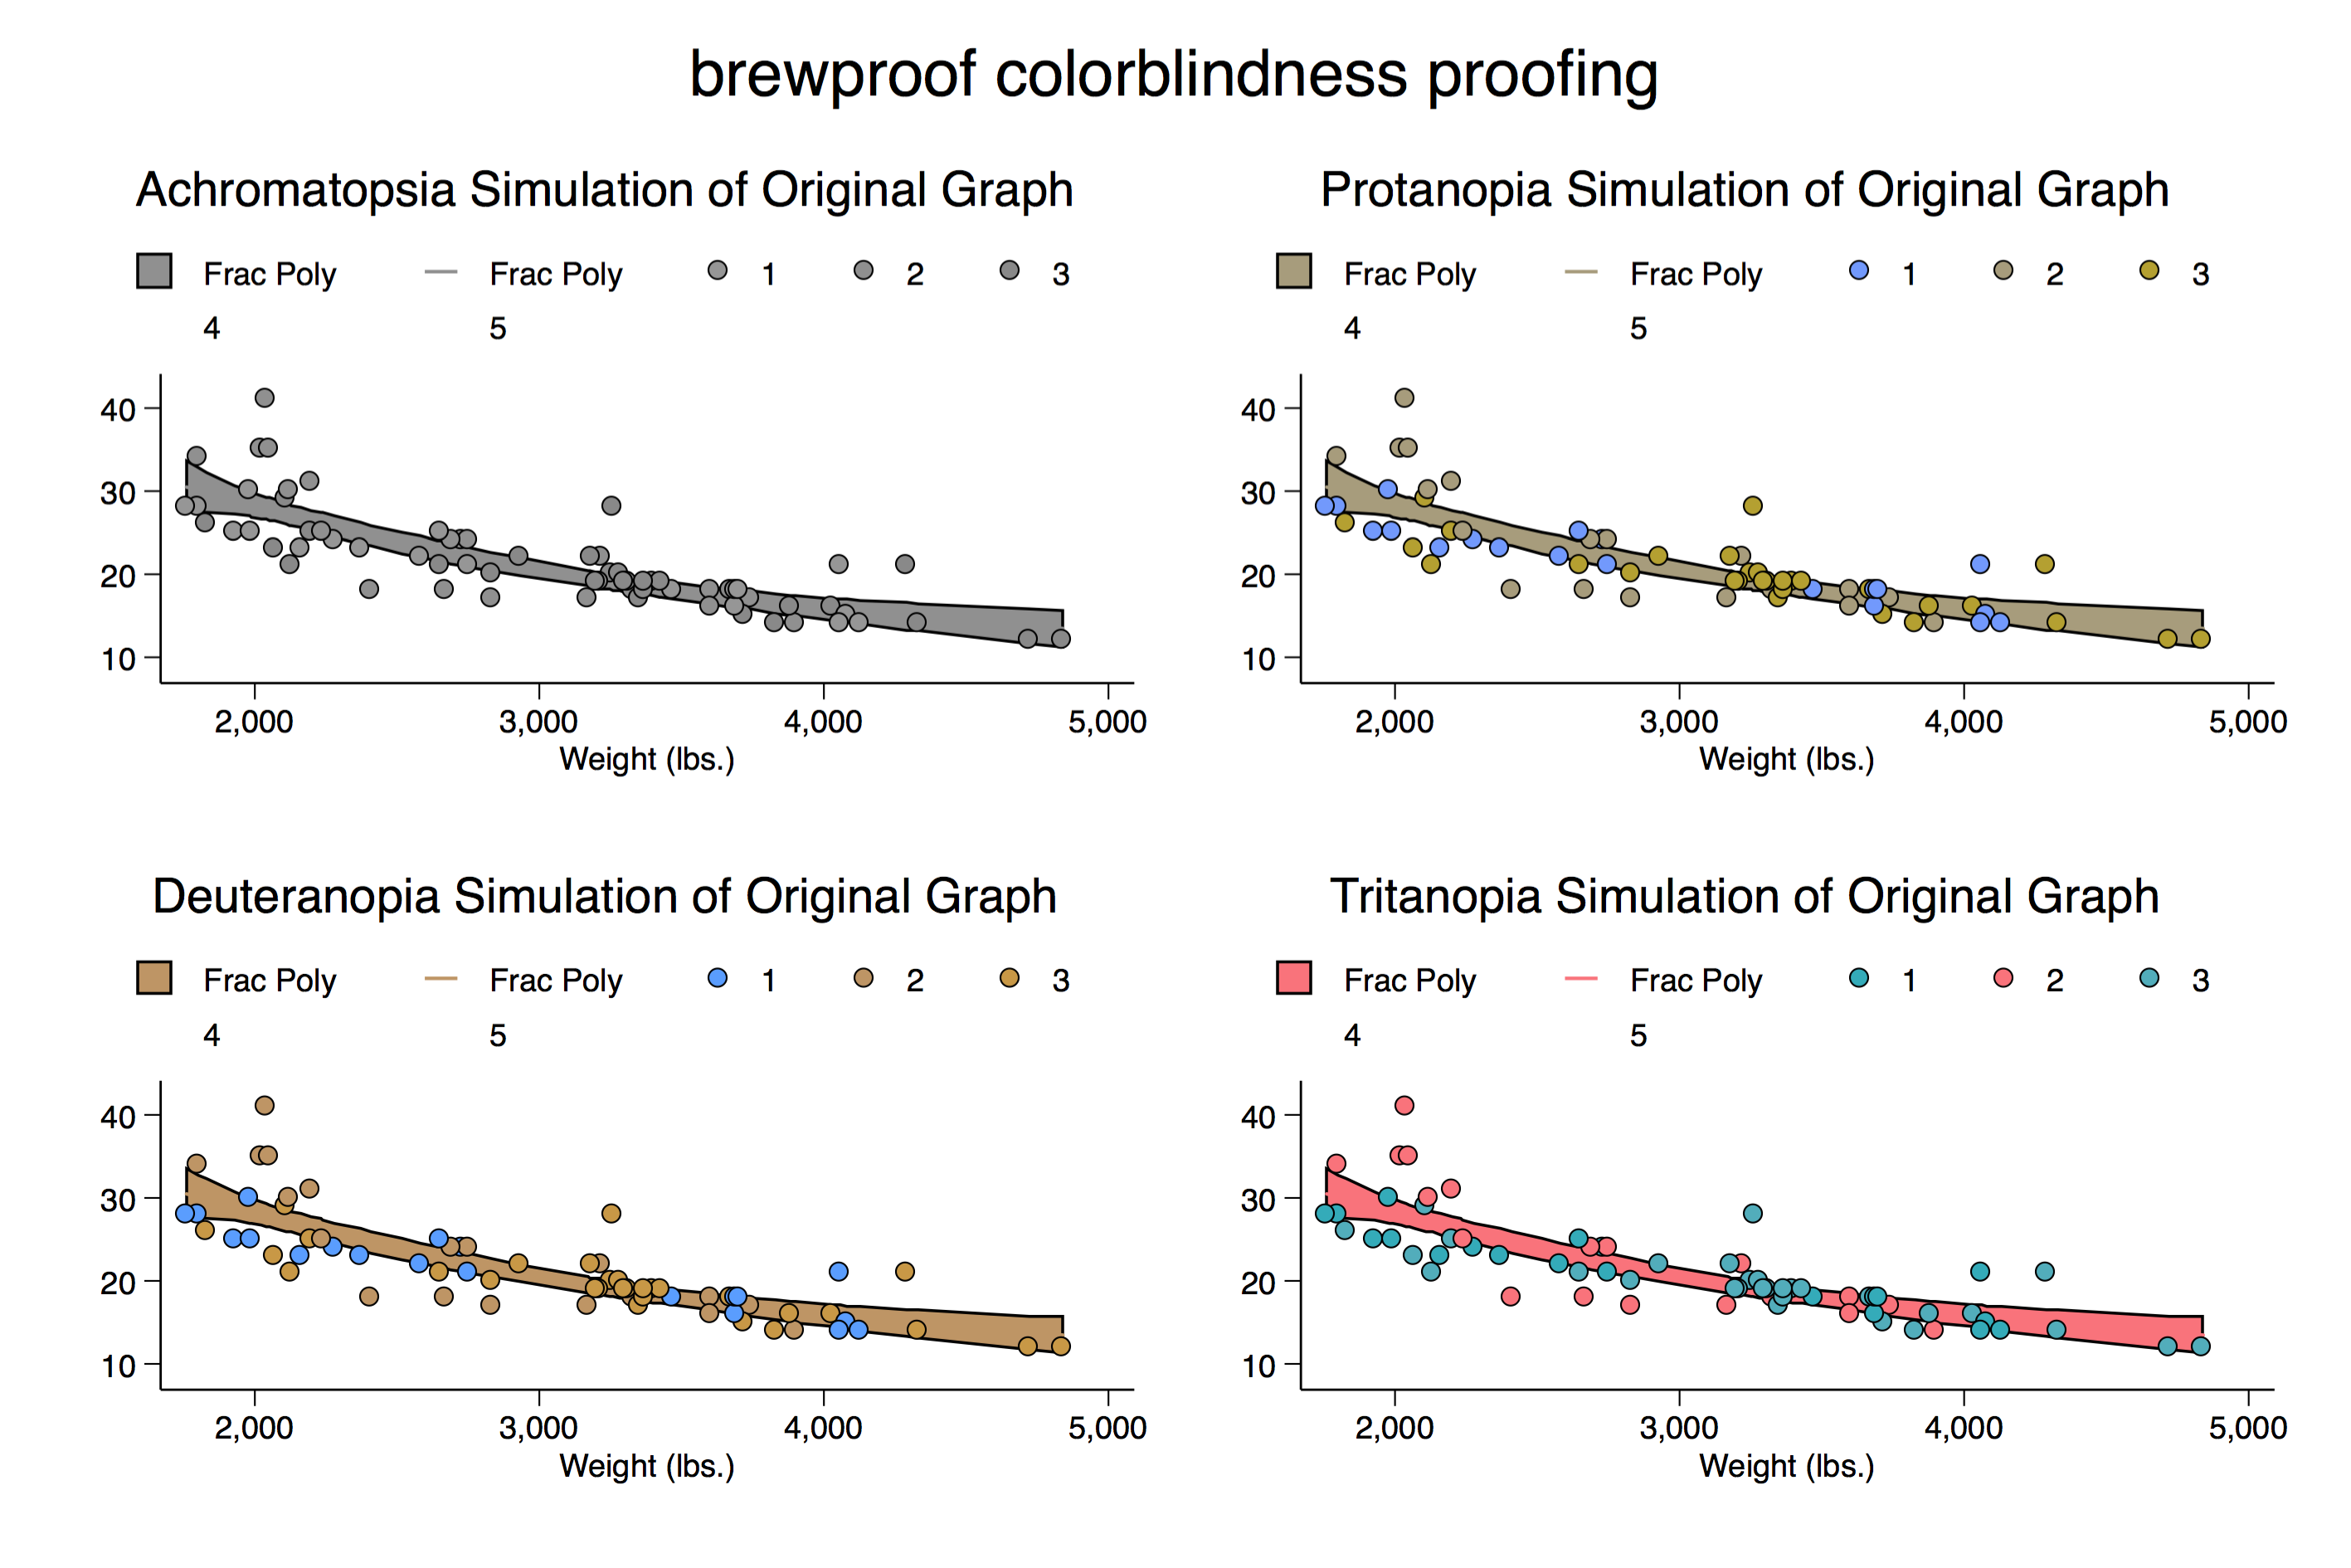
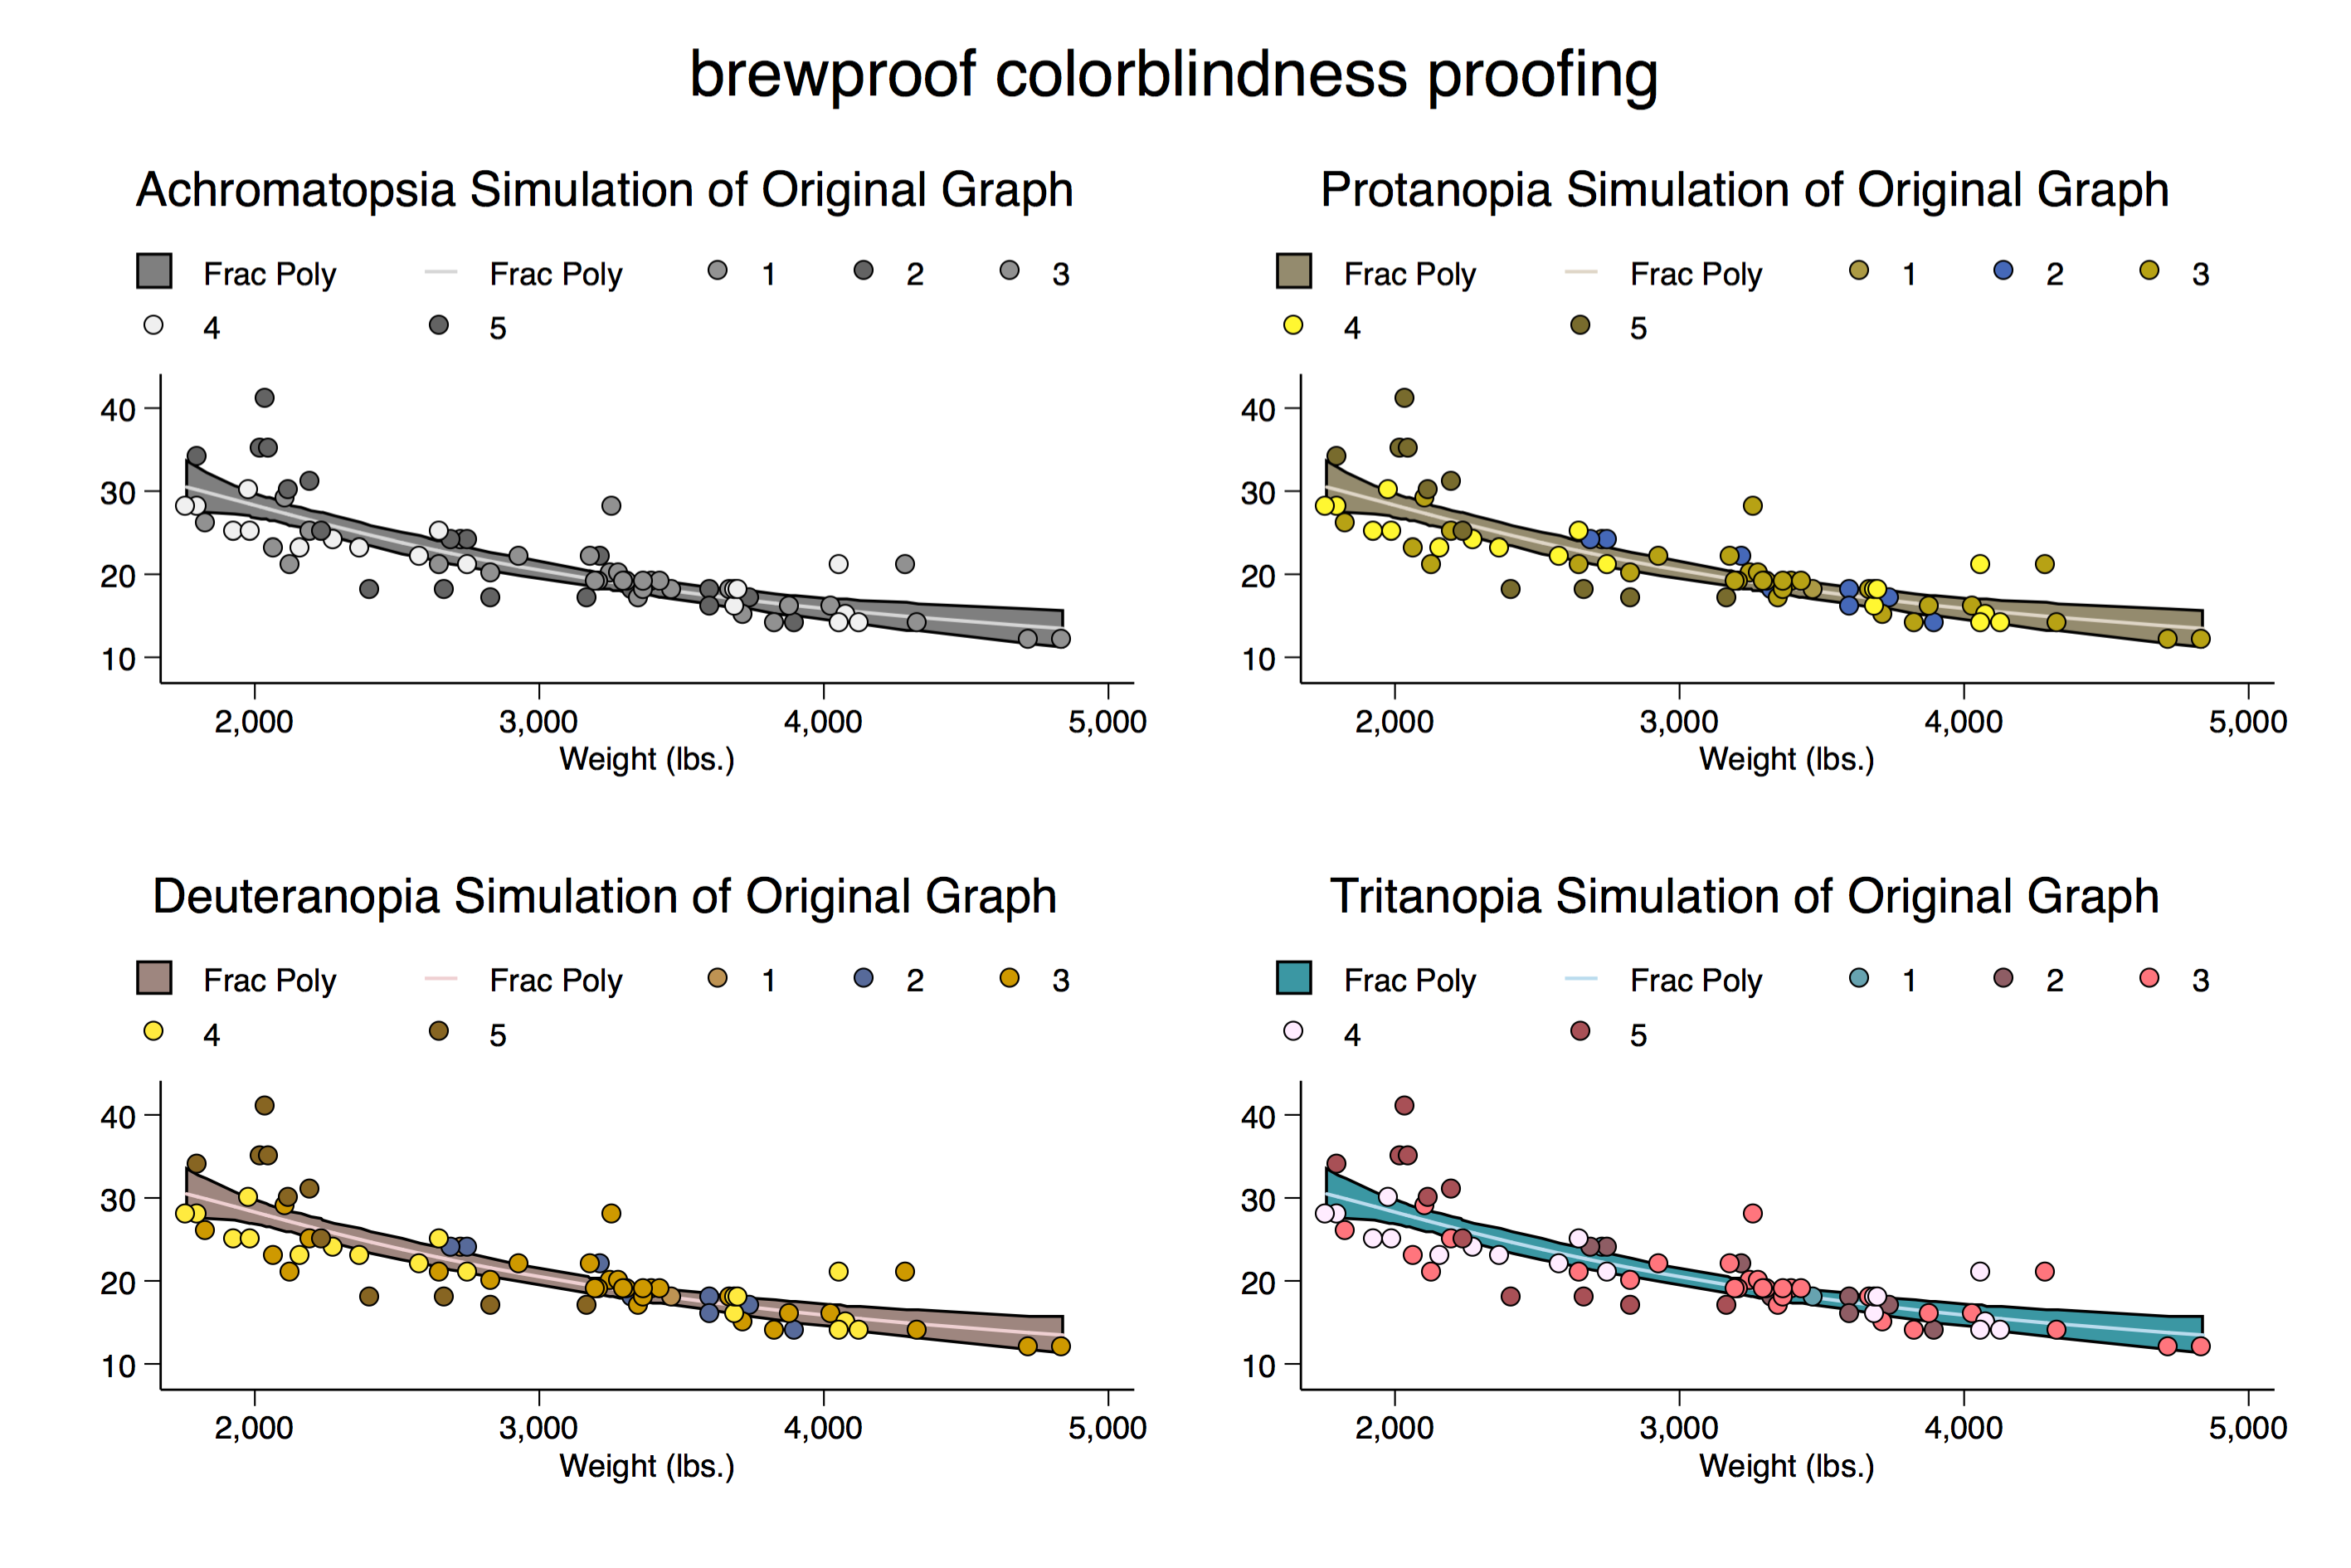
Example based on the ggplot2ex1 scheme:
Example based on the somecolorex1 scheme:
Example based on the manycolorex1 scheme:
Example based on the ggplot2ex2 scheme: